The USD ended on a firm note last week as foreign exchange traders were focused on the divergence of monetary policy between the Greenback and the other G-7 currencies. Over the last several trading sessions, we learned that European Central bank is still open to more stimulus in December, the Australian economy is not as vibrant as the RBA suggests and that the Reserve Bank of New Zealand is thinking about easing again before the end of the year. We also learned that the U.K. economy is slowing at a time when US growth aggregates have been posting mostly stronger numbers for employment, housing and retail spending.
The steady flow of generally hawkish comments from FOMC officials stands in contrast to the dovish language coming from other central banks and has helped the USD Index reach an eight-month high just short of 99.00 at Friday’s NY close. It’s our base case that the likelihood for further interest rate normalization will increase over the next few weeks which will support the USD, keep the SP 500 index in a “buy on the dip” pattern and lift 10-year treasury yields back into the 1.95% area
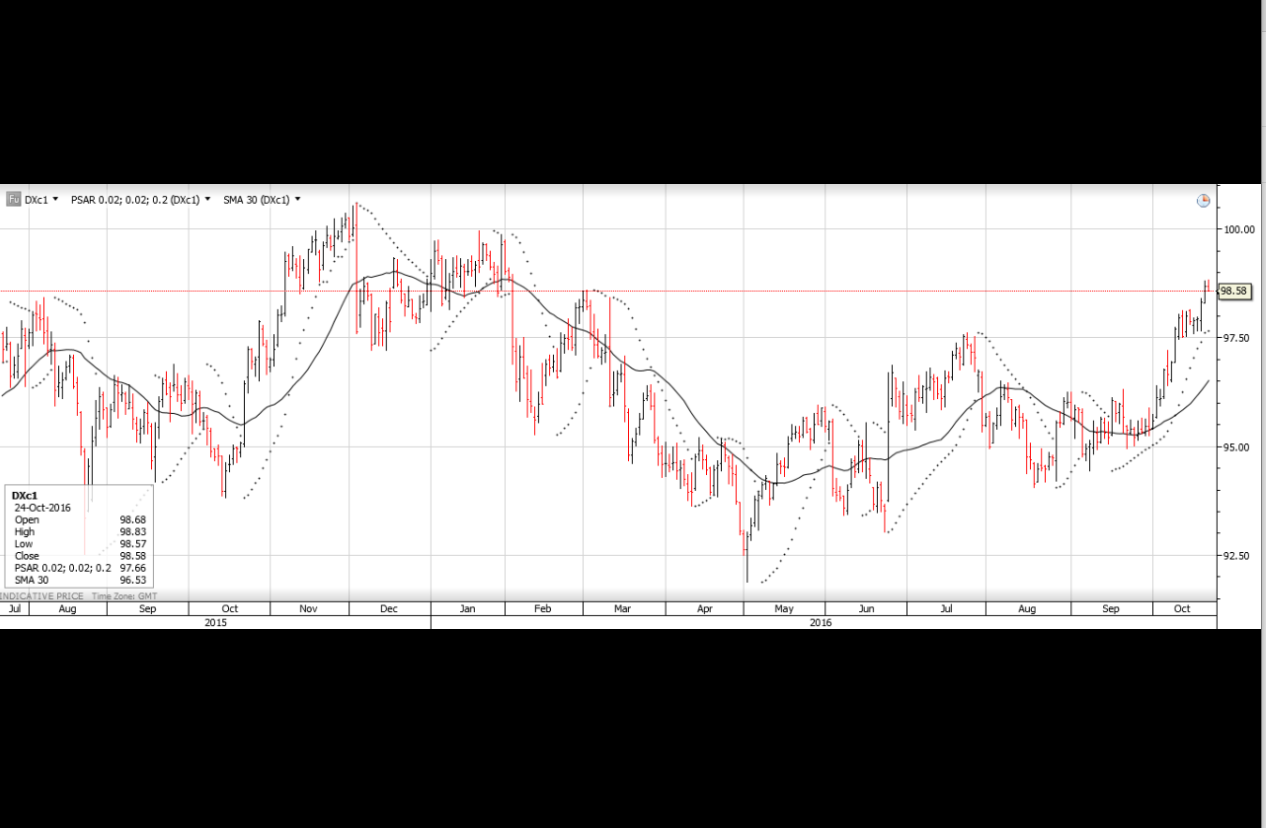
With only a few first-tier fundamental data points scheduled for this week, It’s worth looking at some of the technical price patterns which have emerged over the last several trading sessions. The most prominent technical pattern is the “Golden Cross” in the USD Index. A Golden cross is formed when the 50-day moving average crosses above the 200-day moving average and suggests a continuation to higher levels. We note that the last time this pattern emerged, the USD actually consolidated for a couple of weeks before moving higher. With US Durable Goods orders scheduled for Thursday and GDP to be released on Friday, the consolidation phase could be much shorter this time.
Since the Euro currency makes up close to 58% of the weighting of the USD Index, it’s not surprising that the same moving average time frames have crossed to the downside in the EUR/USD. This pattern is called the “Deadman’s Cross” and suggests last week’s break of the July trend line will see downside range extension this week.