Amcor – FY17 Earnings Update

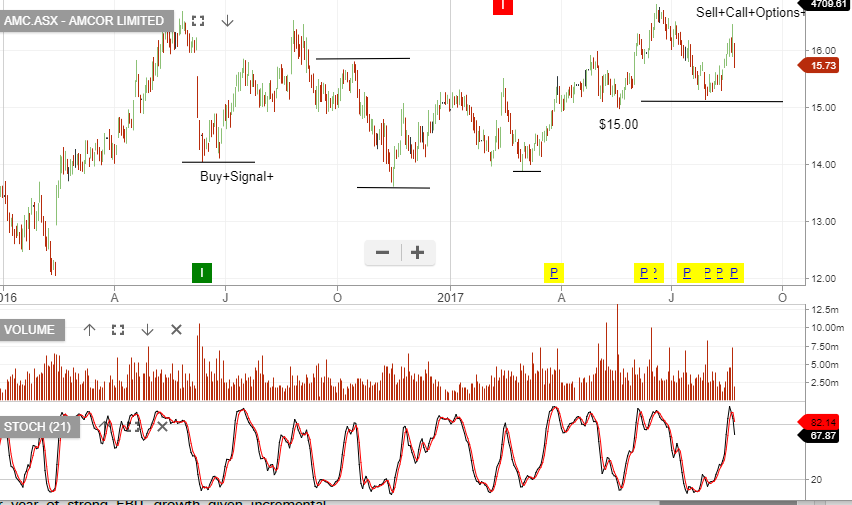
AMC has delivered  FY17 operating earnings of $1.09 billion, up 3% on FY16. The Board declared a final dividend of $0.235.

Underlying net profit for the 12 months to June, came in at $700 million or 4.5% higher on the same time last year.

At 19x forward earnings, AMC is expensive.

However, earnings are defensive and the company should still achieve average EPS growth of 8% into FY18, (net profit in the range of $750 – $770 million), placing the stock of a forward yield of 3.7%.

We expect AMC to trade within a range of $15.00 to $16.50.
Amcor
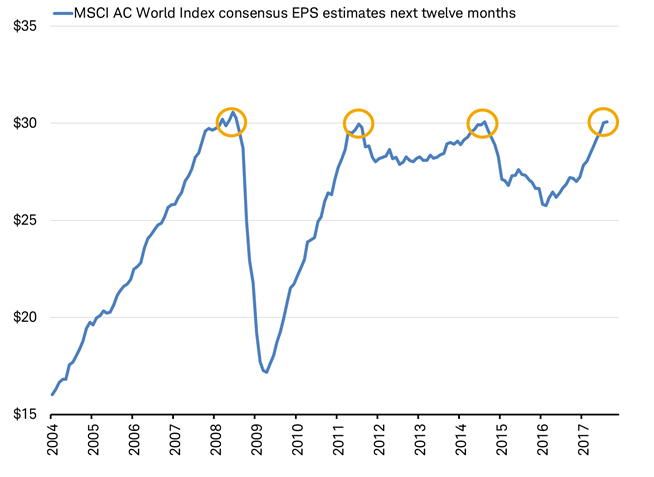


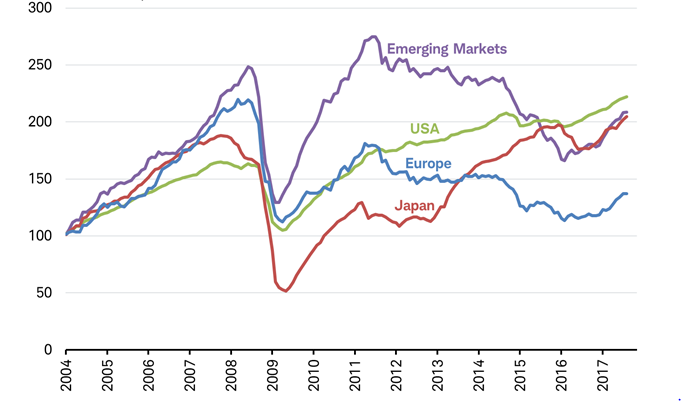
Global Equity Markets – Average Earnings Per Share

Global equity market price-to-earnings ratio are now trading at a 15 year high and average earnings per share sit at prior peak levels.

The World Bank forecasts that global growth will strengthen to 2.7 % in 2017 amid a pickup in manufacturing and trade, rising confidence, favorable global financing conditions, and stabilizing commodity prices.

Growth in advanced economies is expected to accelerate to 1.9 % in 2017, a benefit to their trading partners. Growth in emerging market and developing economies will recover to 4.1 % this year, as obstacles to activity diminish in commodity-exporting countries.

Source: Charles Schwab, Factset Data as of 8/17/2017

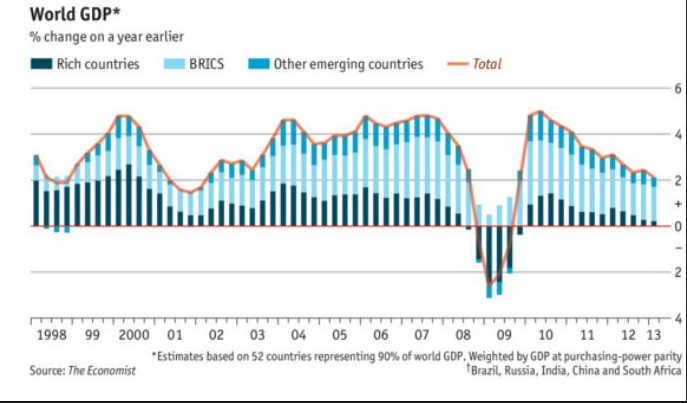
Looking at the graph below, investors can see the difficulty the global economy has had in maintaining GDP growth.

We consider this an interesting contradiction to record PE valuations and EPS growth. For the most part, this is best explained through understanding the impact of share buy-back programs, helping to deliver financially engineered EPS growth.  

Global GDP

Algo Update – WOW & ORG

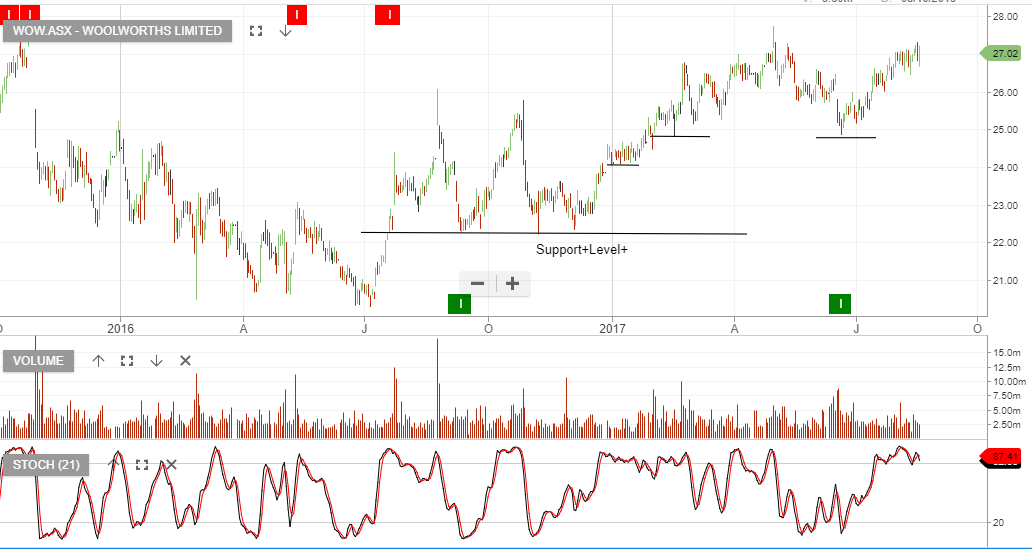
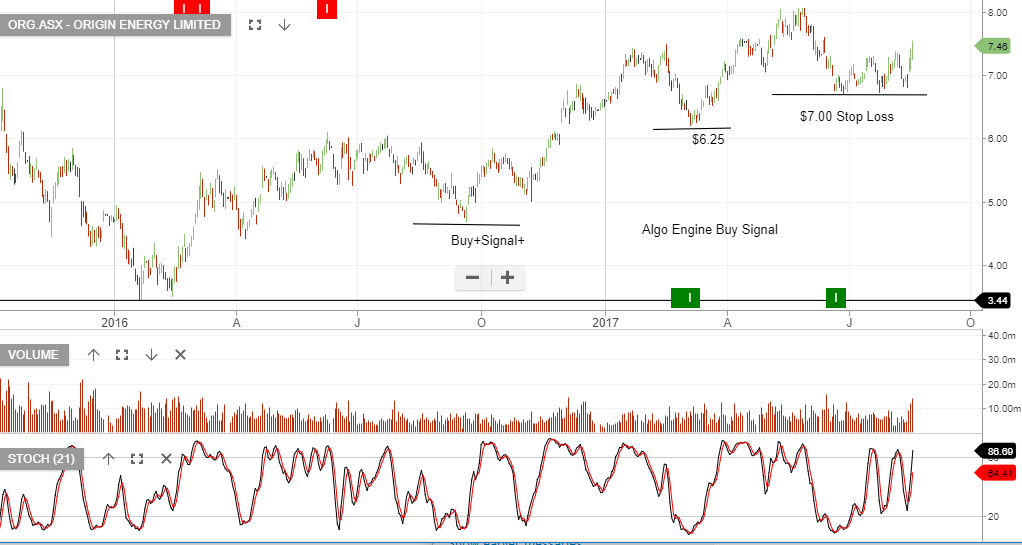
As the Algo Engine identified the “higher low” price pattern in both Woolworths and Origin Energy, we’ve regularly highlighted these as preferred buying opportunities.

We’ve remained buyers of ORG and WOW throughout the past 12 months but now feel that we’re approaching a level where we see full value.

Resistance in ORG will likely be found at or near  $8.00 and WOW is likely to experience selling based on valuation grounds at or near $27.50.

Chart – WOW
Chart – ORG


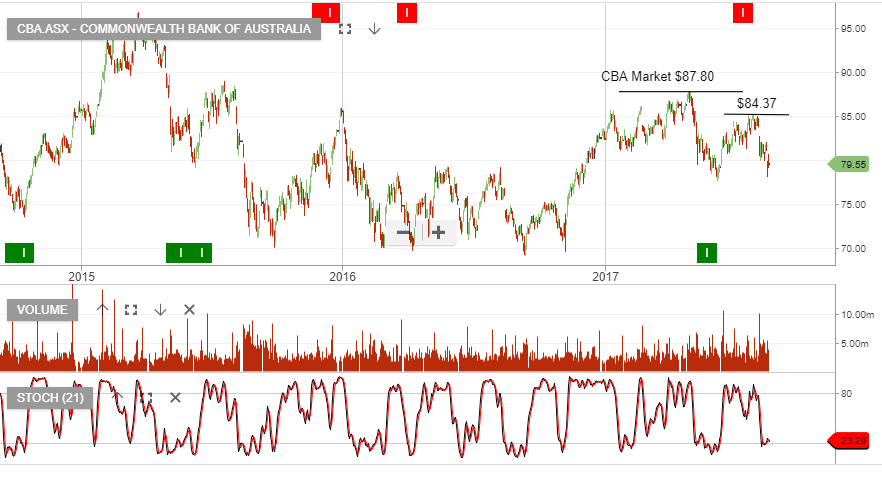
Algo Update – Sell Signal Commonwealth Bank

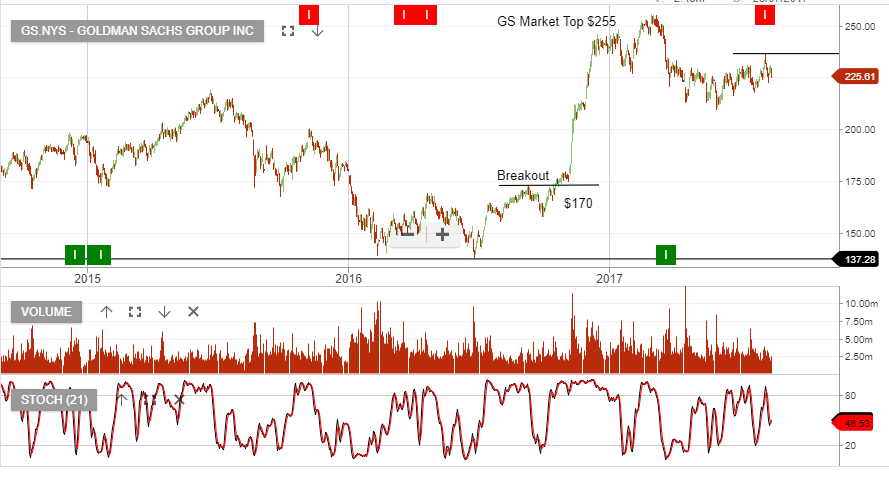
Our Algo Engine flagged the negative technical structure in leading financials firms Commonwealth Bank and Goldman Sachs. These are both leading industry names which have bearish price action developing.

Investors should remain on the short side of these assets.

The charts below illustrate  the recent Algo Short signals along with the resistance or selling pressure, which is now building.

Chart – CBA
Chart – GS

Algo Short Signal – Bendigo Bank

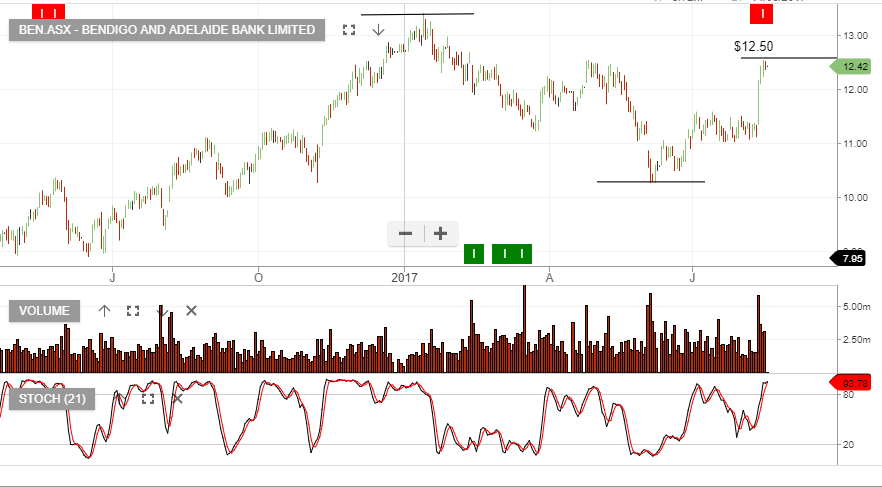
Our Algo Engine is now flagging the “lower high” technical structure in Bendigo Bank.

The stock has seen a short squeeze following the recent earnings result and is now likely to find renewed selling pressure at $12.40.

Investors should remain on the short side of this trade with a stop loss on a break back-up through the $12.50 range.

Chart – BEN

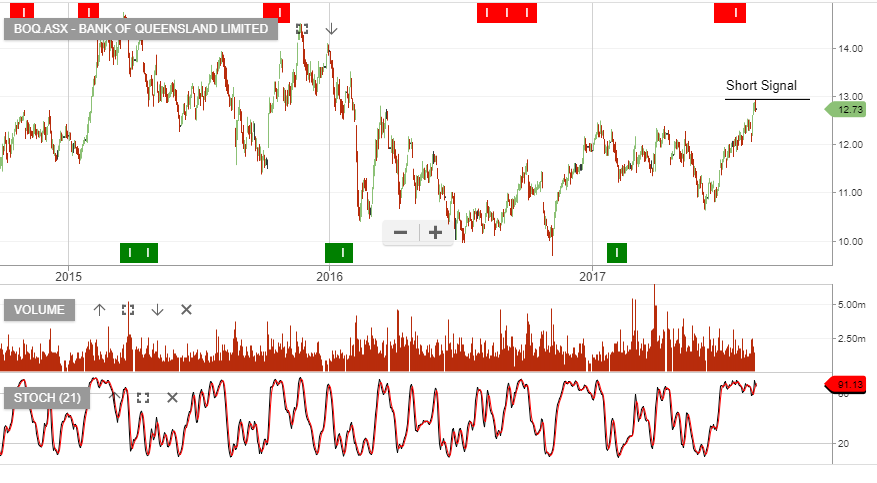
We also have  a short signal in Bank of Queensland.

Chart – BOQ


Death of the high PE

We’ve been warning about a number of ASX large cap stocks which trade on 25X earnings and 2% yield and, at best, will deliver low single digit earnings growth.

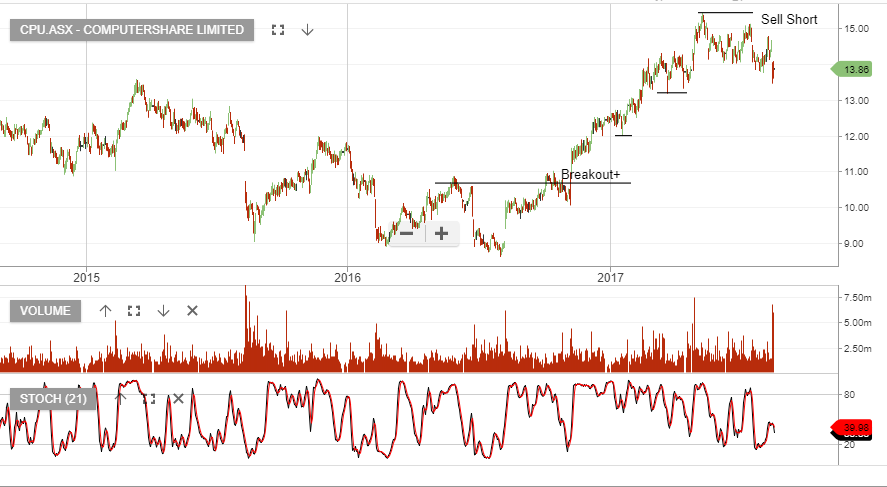
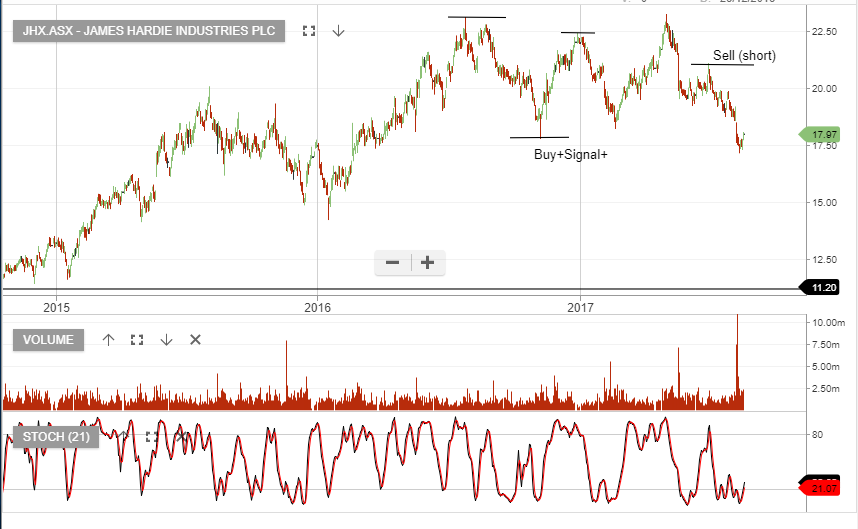
Two examples are the recent sell signal posts we’ve made on Computershare and James Hardie.

We feel that the day of reckoning is approaching and, in many instances, as seen in CPU & JHX, the selling has already started and we’re now seeing a retracement back to the mean, (and likely beyond).

We’ll leave the 150x PE of Amazon, or the 200x PE of Netflix for a future  posting, but suffice to say; reality will soon hit.

Chart – CPU
Chart – JHXASX:JHX