Aristocrat – 1H17 Earnings

Aristocrat Leisure released 1H17 results with revenue and net profit beating analysts’ bullish expectations. Full year guidance was reiterated with profit growth likely to be + 20-30%.

North America and Digital underpin a strong earnings outlook and the company’s strong balance sheet, will likely see excess capital returned to shareholders and/or new acquisitions announced.

The company declared a dividend of $0.14 for the half-year, which was up from $0.10 in 1H16.

FY18 revenue is likely to increase 10%+ to $2.7b, EBIT $900m on EPS of $0.90, DPS of $0.36, placing the stock on a forward yield of 1.8%.

Our Algo Engine last generated a buy signal in October 2016 at $15.00
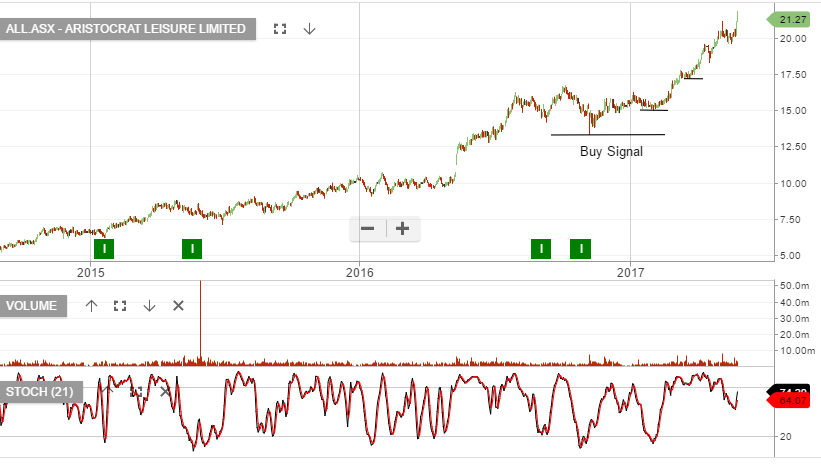
Chart – ALL


Big Week Ahead For The Aussie Dollar

The AUD/USD ended the week with a softer tone at .7450, as S&P lowered the credit scores of 23 Australian financial institutions and Moody’s downgraded China’s sovereign credit rating.

This week’s retail sales and manufacturing data will have an impact on the next move in the Aussie.

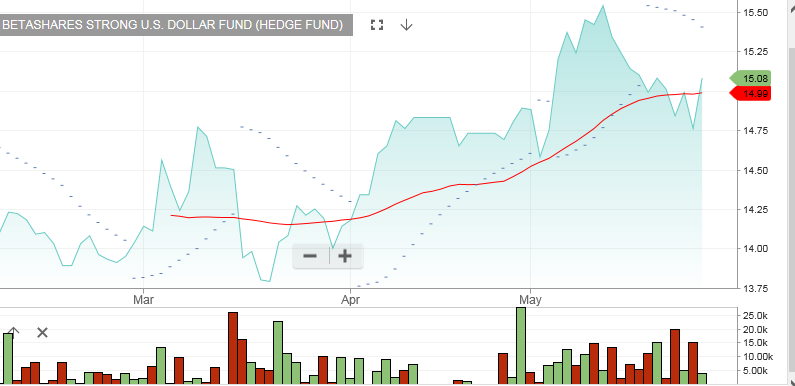
Investors looking to profit from a lower AUD/USD can buy the BetaShare inverse ETF with the symbol: YANK.

The current price of YANK is $15.08. When the AUD/USD fell to .7330 on May 9th, the price was $15.55.

We estimate that when the AUD/USD trades down to the January low of .7160, the unit price for YANK will be approximately $16.50.

BetaShare YANK ETF


ETF Update: MVB Covers All The Aussie Banks

Since the beginning of May, shares of the “Big 5” banking stocks have dropped between 8 to 10%.

We expect to see a bounce of some degree in the near-term, but it’s difficult to predict which name will see the most significant rebound.

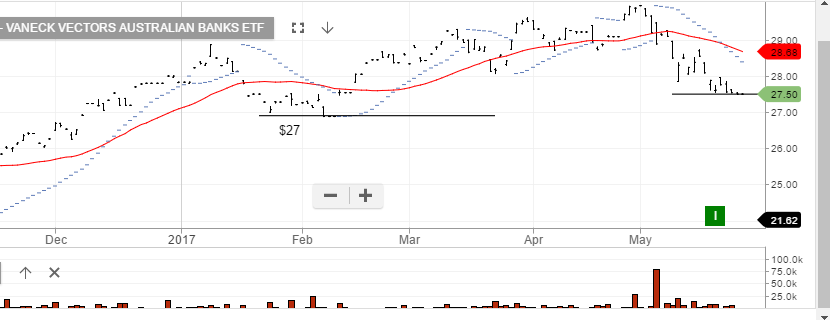
For investors looking to take a step back into the long side of the banking sector, we suggest the Vaneck banking EFT with the symbol: MVB

This Exchange traded fund has dropped from $30.00 on April 27th the current price of $27.30. We believe a small allocation at these levels, for a bounce back to $28.75 would represent a solid “tactical” trade.

MVB Aussie Bank ETF

Ansell: Looking Good For A Buy/Write Strategy

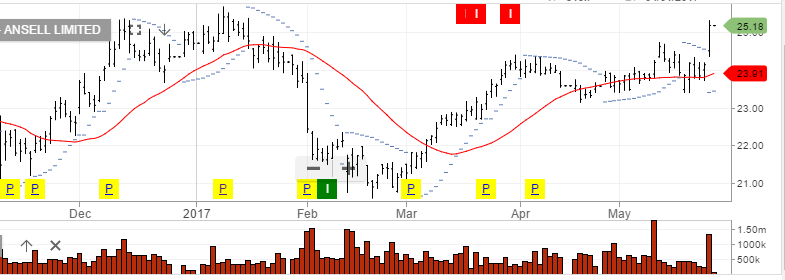
Shares of Ansell (ANN) reached a 5-month high of $25.30 yesterday as a Chinese consortium agreed to buy part of their non-core asset group for $800 million.

In announcement after the agreement, ANN officials outlined a plan to buyback up to 10% of the company’s common stock over the next 12 months.

We believe this development will underpin the share price to the downside. However, $26.00 could could be a difficult level to clear, even with the buyback.

With today’s sharp sell off into the $23.00 handle, ANN shares are a good candidate for a buy/write strategy. Selling the $26.50 calls into December will enhance the returns, and keep investors exposed to the August dividend of approximately 32 cents.

Ansell


Limited Upside In QBE

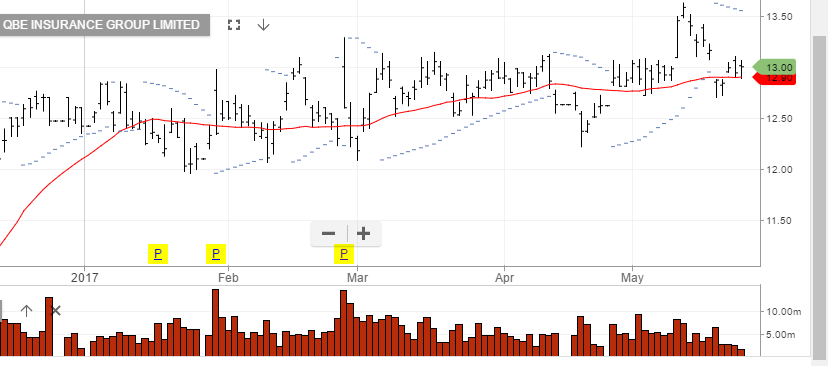
QBE Insurance posted an $844 million net profit on May 3rd, which was their best result since 2010.

By May 11th, the share price had raced to a new high for the year at $13.60.

With internal momentum indicators beginning to turn lower, we are suggesting to exit long positions or sell the $13.50 covered calls into September.

We expect to see good support in the $12.00 area as a medium term target.

QBE


Chart Watch – XJO

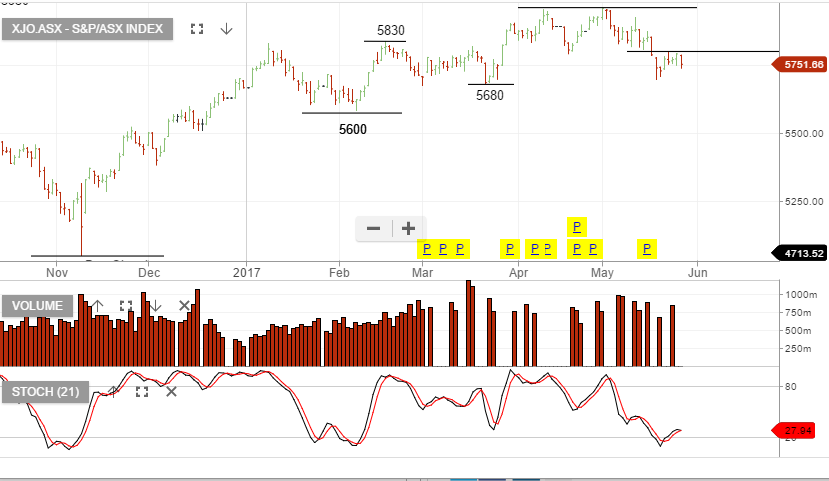
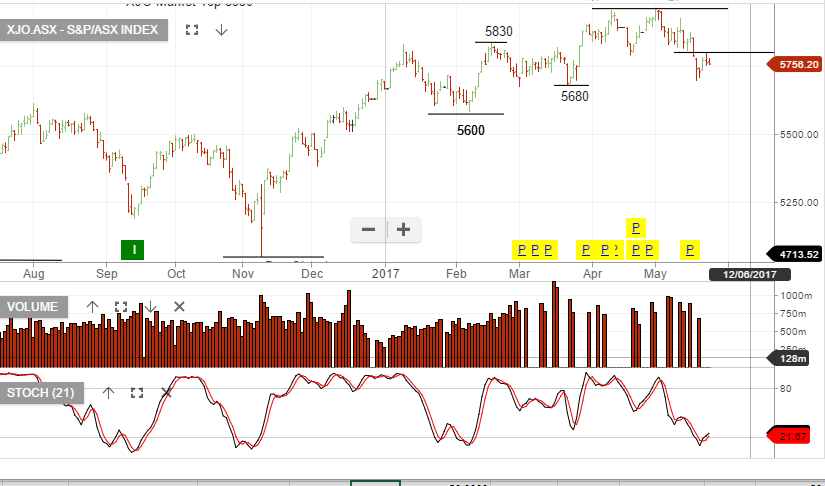
As an update to our recent Chart Watch on the XJO, we highlight again the lower high structure that has now formed. We were expecting a bounce into the 5790 – 5850 level before further selling pressure. Yesterday the price action hit resistance at 5796 and today’s open looks weak against a  positive lead from the US.

Chart – XJO

.


Boral -FY18 Outlook

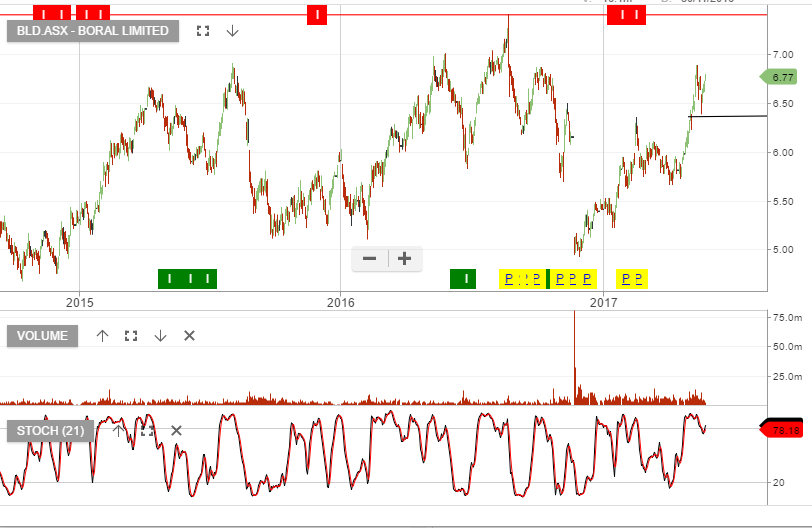
The market remains optimistic about future earnings growth for Boral. The recent Headwater acquisition in the US provides Boral with added exposure to the US housing market. Domestically, Boral is well placed to benefit from the an increase in large scale infrastructure projects.

We feel some caution is warranted though, given the weaker trends emerging is both US and domestic housing construction data. The stock trades on 19x forward earnings and less than a 4% yield.

FY18 revenue is likely to be $5.8b, EBITDA $1.15b, Net Profit $490m and DPS of $0.29.

Chart – BLD


JHX Points Lower On Weaker US Housing Data

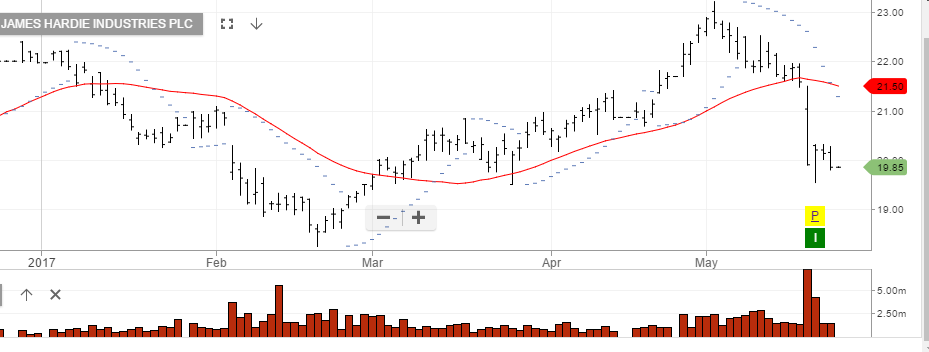
Since trading as high as $23.20 on May 2nd, shares of JHX have dropped over 14% and are now trading below $19.80.

We posted a report on the blog on May 19th pointing out that JHX reported FY17 results which were below market expectations.

Overnight, US New Home Sales fell to 569,000, well short of the consensus expectation of 610,000. As new home construction continues to slide, we sell further downside range extension for JHX.

The new key support level comes in near the February low of $18.20.

James Hardie


Gold Firms, But NCM Still Lags

On May 6th, we posted a report on the blog which suggested that both Spot Gold and shares of NCM were in oversold territory.

At that time, the prices were at $1225.00 and $20.10, respectively. Now, Gold is back over $1250 and looking firm on the internal momentum indicators. We expect the yellow metal to test April 17th high on $1290.00 in the medium-term.

In this sense, shares of NCM have lagged behind the spot gold price and have gained just over $1.00 during the same period.

We still consider NCM undervalued at current prices and suggest buying outright shares, or call options out to July, for a medium-term price target of $25.50.

Newcrest Mi