XJO – Chart Update
The XJO remains range bound with the most current level of support at 5640.

The XJO remains range bound with the most current level of support at 5640.
From yesterday’s group of Algo Signals, we’re now tracking GEM as a potential short.
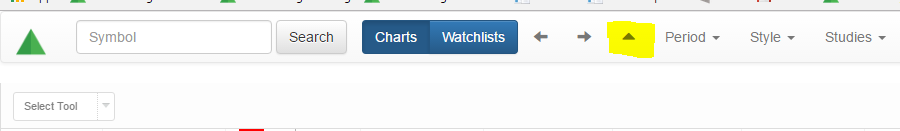
We’ve added a new feature to our charts, which now includes the ability to turn on or off the access or viewing of “Leon’s Chart” function. The image below identifies the highlighted button in yellow. Click this button on your charts to enable the feature.
After reaching a high of $1263.00 on February 27th, the price of Gold has dropped over $45.00 to close today at $1216. 00.
Technically, this price represents the first daily close below the 30-day moving average since January 2nd, and points to the next key support level at $1200.00.
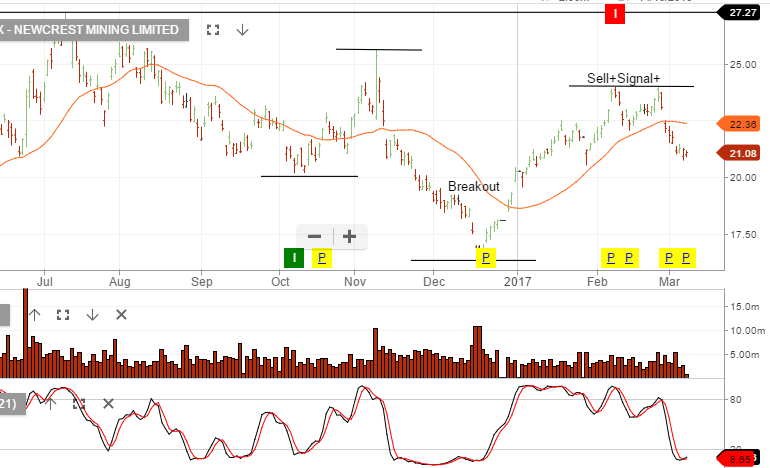
On February 8th, the Investor Signals Algo engine generated a short signal on Newcrest Mining at $23.95. Investors who were holding long positions were given the signal and had the opportunity to sell covered calls, or sell the shares outright.
Shares of Newcrest are now trading near initial support at $21.00.
However, with momentum indicators pointing lower, a realistic near-term target could be found near the former “double-top” high at $20.40.
The RBA is widely expected to keep interest rates unchanged today.
Foreign Exchange investors will be listening for comments about the Aussie Dollar.
The AUD/USD has risen by 4.5% this year on a trade weighted basis, and RBA Governor Philip Lowe has signalled that the central bank would like a weaker currency.
The sharp improvements in domestic terms of trade (rising coal and iron ore prices) appear to have largely run their course. The AUD/USD was sold through .7600 last week for the first time since late January. Initial support is now seen in the .7530 area.
In the last RBA statement, Governor Lowe made it clear that he was looking at three factors in determining the path for monetary policy: Inflation, the labor market and household balance sheets.
Of these factors, weakness in the labor market looks to be supportive of another rate cut.
Looking at the expansion of household balance sheets suggests the RBA should look to raise rates. However, the benign outlook on price inflation signals that the central bank can leave rates unchanged.
We will see the result at 2:30 Sydney time.
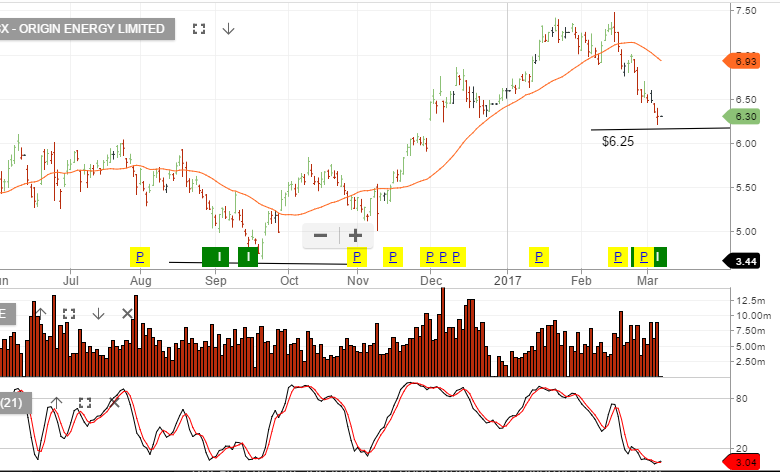
Origin has been triggered as a buy signal from our Algo Engine. We expect the stock to find buying support at or near the current price level.
Since posting a high of $84.00 last September, shares of Ramsay Heath Care have dropped almost 20% to below 67.50 today.
This decline has adjusted the share price to 26 X estimated 2017 earnings. While this multiple is not cheap, it looks like fair value considering Ramsay’s strong long-term growth prospects and dividend history.
Since the private hospital operator started paying dividends in 2007, it has increased its payout to shareholders every singe year. This is a streak that includes 21 consecutive dividend increases.
Based on the last 12 months of dividends, Ramsay’s shares are currently offering a fully-franked 4.8% yield, which tips up to almost 7% when the franking credits are included.
Further, the company has given guidance that 2017 profits could increase by 20%.
Our Algo Engine triggered a short signal in AMP on the 9th of January when the stock was trading $5.30. The current chart pattern suggests the bounce off the recent low could be running out of steam and selling pressure may resume again.
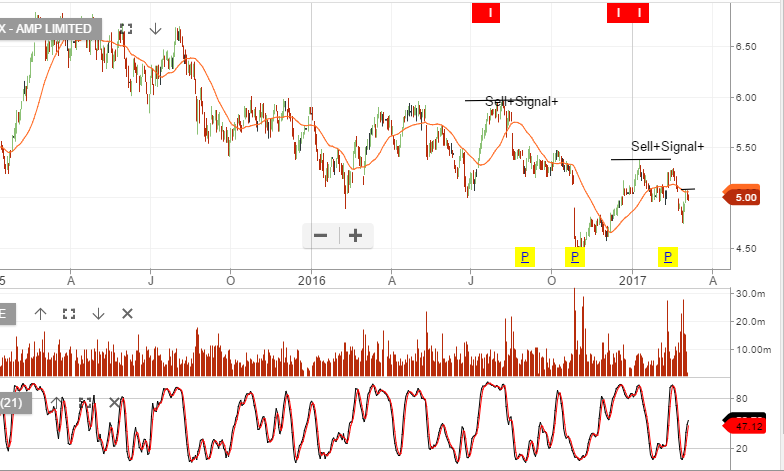
Chart – AMP
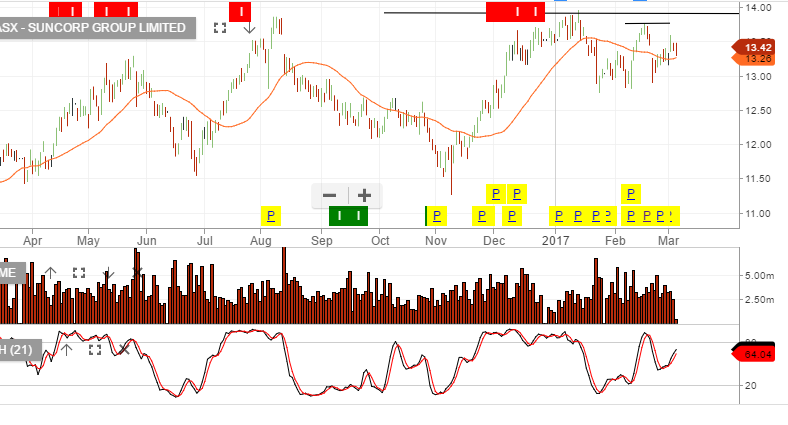
Suncorp found resistance in early January at $14 and has since made a series of lower high formations.
Our Algo Engine triggered a short signal back in December.
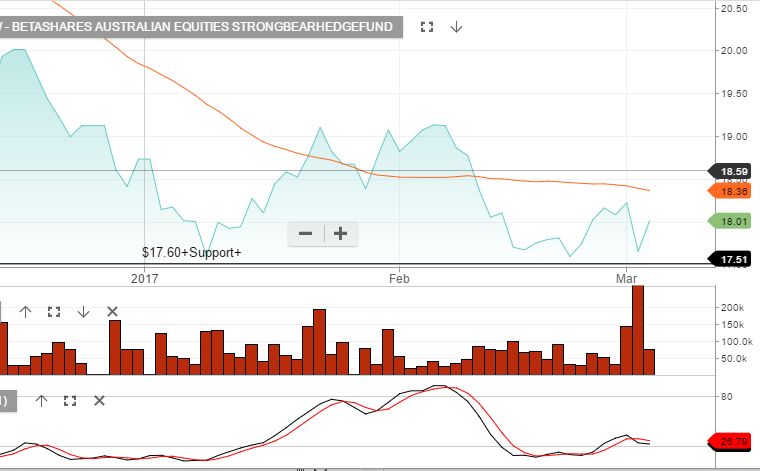
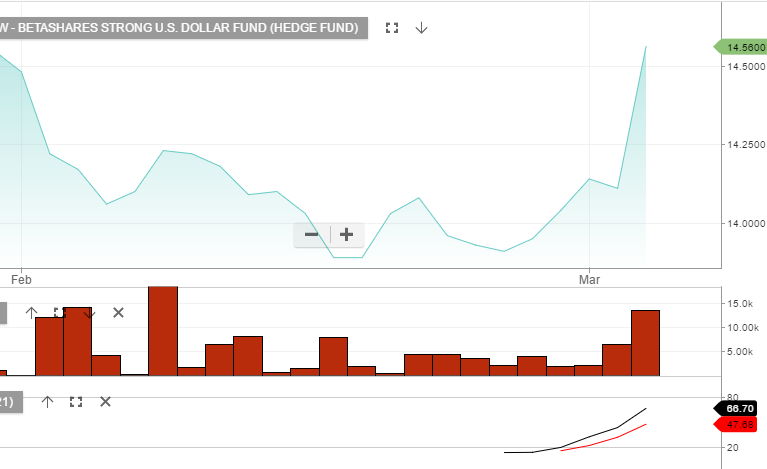
As the AUD/USD broke down through the .7600 support level, and the XJO dropped over 1% on the day, the two biggest gainers in the local ETF market were BBOZ and YANK.
The BBOZ is an ASX listed inverse Exchange Traded Fund tied to the local share market, which means the price of the shares rose over 2% to $18.05 as the shares on the XJO index traded lower.
Similarly, the YANK is an inverse fund based on the price of the AUD/USD. It has a weighting of 2.5%.
As such, shares of the YANK ETF rose 3.15% to $14.60 as the price of the AUD/USD fell close to 1.5% to .7550.
In remarks earlier today, Fed President Janet Yellen indicated a readiness to raise the US funds rate at the FOMC’s March 14-15 meeting.
In fairly explicit language, she said that as long as “employment and inflation are continuing to evolve in line with expectations”, “a further adjustment of the federal funds rate would likely be appropriate”.
As a result, we now see a hike at the March meeting as close to a done deal, and see the market probability raised to 95%.
Considering the fact that the Fed Funds futures contract was reflecting a probability of around 30% just over a week ago, this has been a very sharp turn in policy sentiment.
As a result, US 10-year yields touched 2.52%; close to a 3-month high.
In typical market conditions, a US rate hike is Bullish for the US Dollar and Bearish for Stocks, Commodities and Crude Oil
Level 17 Chifley Tower
2 Chifley Square
Sydney, NSW 2000
1300 614 002
Investor Signals Pty Ltd
ABN 44 143 555 453