Short Positions – Starting to Roll Over

Over recent weeks, we’ve highlighted a number of stocks that are overvalued and susceptible to any increase in market volatility or risk-off period.

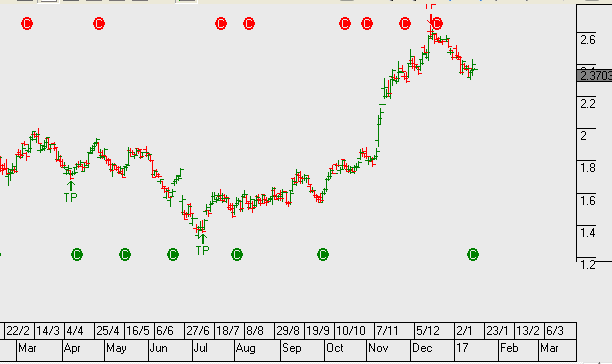
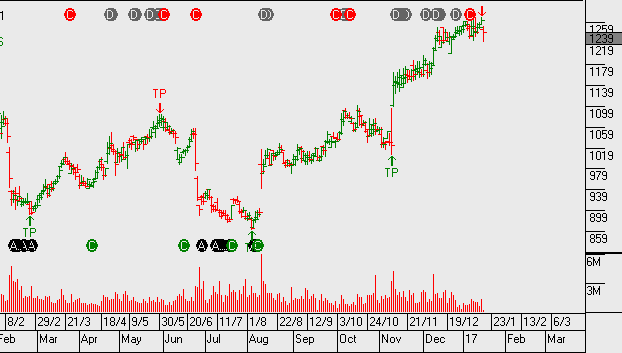
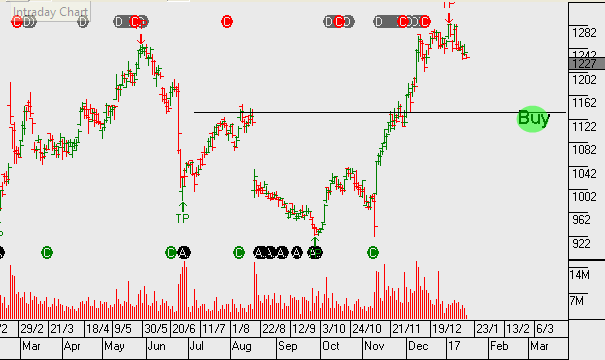
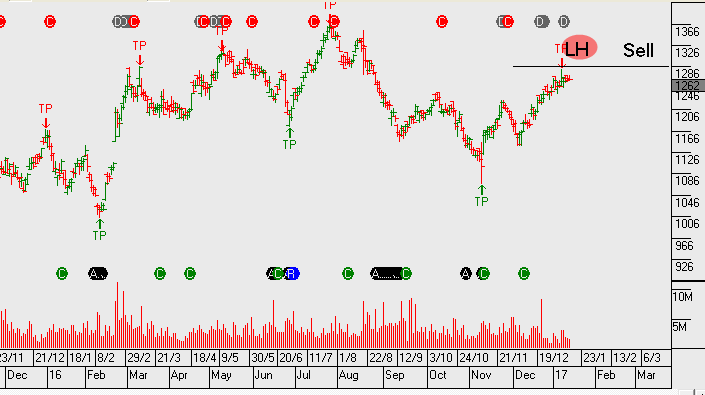
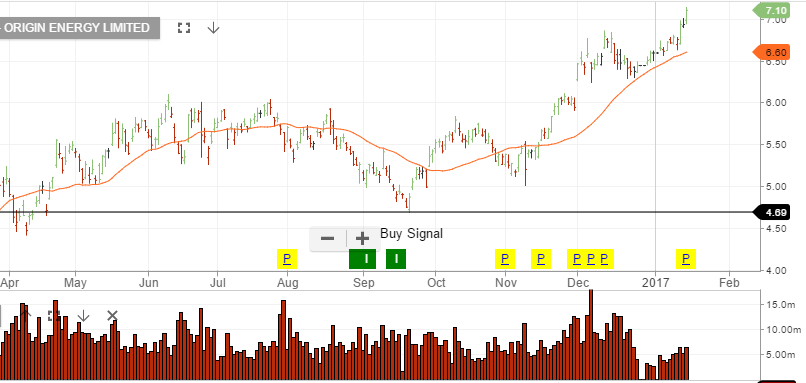
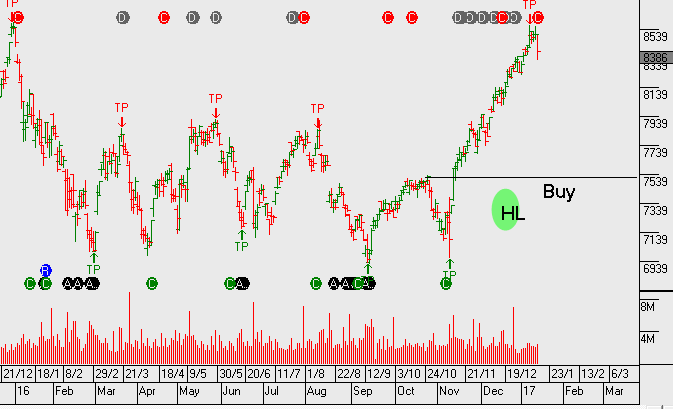
Stocks that have rallied due to higher US interest rates are starting to retreat as the yield on the US10-YR starts to slip lower from the recent 2.64% high. Companies affected in this group include Computershare and QBE.

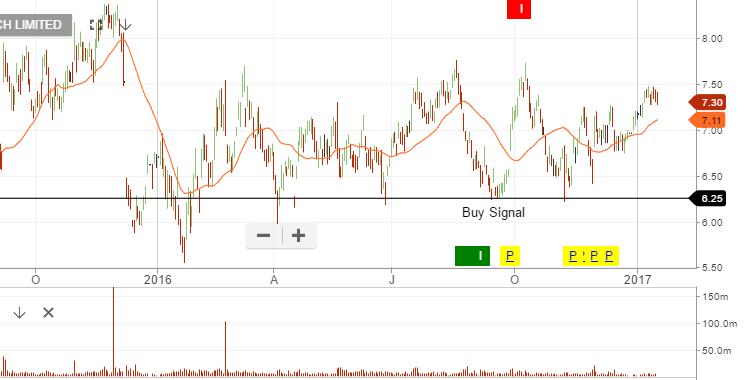
Australian Banks are beginning their sell-off and our bank hedge is starting to pay-off.

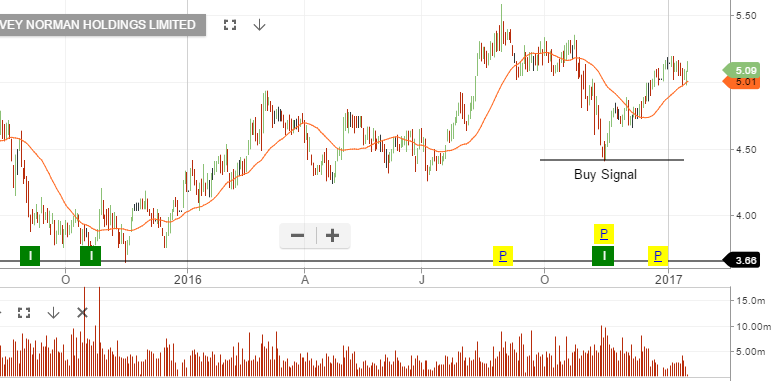
Exiting property plays, especially where there’s development risk will likely prove worthwhile in the coming months. We’re happy to stay exposed to the best-of-the-best only in this space and sell tight covered calls.

The issue we see is that the US bank results out so far, is probably as good as it gets for US 4Q earnings. Over the next two weeks, multinationals, industrial names and then big technology will announcement their results.

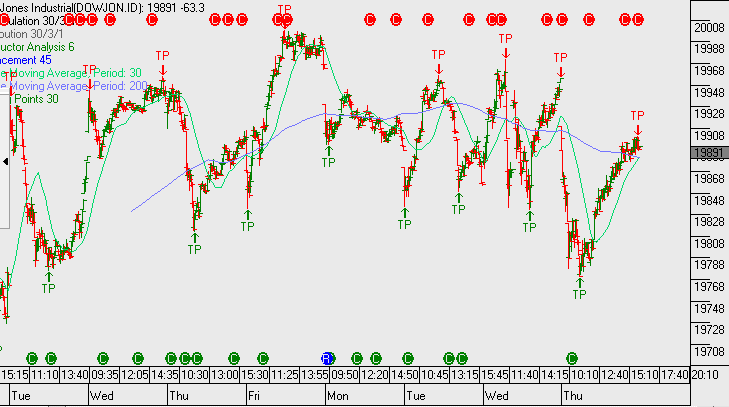
If we see an average EPS run rate for the S&P500 that fails to meet the $132 per share expectations, and in fact averages somewhere in the range of $120 – $125, then the Dow Jones will struggle to move higher.

With the above in mind, we’ve been making adjustments to portfolios to hedge an uptick in volatility and deliver returns through an aggressive derivative overlay.

Chart – US 10YR
Chart – CPU
Chart – QBE


Strong Demand For LNG

With a 27% price increase since mid-November, LNG is one of the hottest commodities in the world.

New data on LNG rates show that the price of shipped natural gas for Asian delivery has jumped $1.95 per MMBtu to $9.20 per MMBtu.

A big part of the increased demand is coming from China, which saw its LNG imports rise to a record high of 47% in November as compared to the same time in 2015, to a total of 2.66 million tons.

South Korea was also reported as a big driver for LNG demand , with that nation buying cargoes to replace power generation lost during maintenance of four domestic nuclear power plants.

Our preferred energy names remain WPL, ORG & OSH.

Chart – OSH


US Retail Sales Post A Mixed Result

Friday’s US Retail Sales report showed strong demand for automobiles and furniture, providing further evidence that the economy ended the fourth quarter with momentum at the retail level.

The Commerce Department reported that retail sales rose 0.6% in December after increasing by 0.2% in November. Sales were up 4.1% on a year-on-year basis from December 2015 and rose 3.3% for all of 2016 versus 2.3% for all of 2015.

The Core Retail sales figures, which exclude cars, gasoline, building materials and food, rose 0.2% after being flat in November.

The Core Sales data corresponds more closely with the consumer spending component of the GDP and printed below the 0.4% forecast. Despite the smaller gain in Core Retails sales, the consumer spending trend in the US remains solid.

Chart – HVN

This Week’s Key Earnings Reports

US Financial markets will be closed on Monday for a bank holiday. After that, the rest of the week has several top financial names which will be reporting Q4 earnings. The dates and the street estimates for earnings and revenue are as follows:

Tuesday:    Morgan Stanley (65 cents/ $8.46 billion)

Wednesday: Goldman Sachs ($4.74/ $7.76 billion)

Citigroup           ($1.12/ $17.29 billion)

Thursday:   American Express ( 98 cents/ $7.95 billion)

IBM   ($4.89/ $21.70 billion)

Friday:     General Electric  ( 46 cents/ $33.94 billion)

With stock index prices pushing up against record highs, earnings reports will likely have to be flawless to match the market’s expectations. If any of these first-tier financial names post materially lower numbers, the risk is that the market may have gotten ahead of itself in the post-election rally.


Algo Short Signals – Why So Many?

Over recent weeks, our Algo Engine has been flagging a number of short signals. This is indicating there’s a large number of stocks that are at the peak of their counter trend rallies. As the key indices start to struggle, we’ll begin focusing on the short signals with a view towards either taking profit on existing long positions, overlaying a call option on defensive names or positioning on the short side to profit from any sell-off  in over valued names.

In the January Video Market Update on the ASX Top 50, which we will release in the coming days, we’ll explain more on the algo short signal patterns emerging and how we’re positioning portfolios for what we think is a period of increased market risk.

We’ve used the chart below of BXB to help illustrate the counter trend pattern referred to in the text above. In the case of BXB, the algo signal has drawn our attention to the recovery BXB has had since November, the compressed forward yield of now only 2.8% and the high PE ratio. In response, we’ve used the signal as  a trigger to sell $12.50 at-the-money call options into April for a $0.50 credit, whilst expecting to keep exposure to the March $0.15 dividend.

Chart – BXB


Early Days on The Bank Hedge

We’ve been running a hedge on the Australian banks; CBA through an in-the-money European March option, NAB using an in-the-money American February option and WBC a longer-term call option. In ANZ our preference has been to exit the trade altogether.

On Friday, our domestic banks started to see some profit taking and the catalyst could’ve been selling ahead of the US banking results and/or the announcement of weaker export data out of China.

JP Morgan and BoA’s results , released last night, were adequate on the bottom line but both companies missed on the revenue front. Increased dividends and share-buybacks helped support what otherwise would’ve been viewed as weak results.

Chart – CBA
Chart – WBC
Chart – NAB
Chart – ANZ


RIO – Q4 Production Report

On balance, 2016 wasn’t a bad year for RIO Tinto. After posting a 7-year low at $36.50 on February 1st, shares of the mining giant closed out the year just below the $60.00 mark (a 64% gain).

This impressive turn-around was supported by a broad rebound in Iron Ore, Copper, Coal and Aluminium. Rio has an impressive portfolio of assets. It anticipates solid growth in Iron Ore production in 2017, with a large copper project coming online over the next decade.

The company has a market cap of just under $80 billion.

On Tuesday, RIO will release its Q4 2016 production report. We expect the report to show a modest 1% lift in quarter-to-quarter production, driven primarily by Q4 strength in Iron Ore production and shipments from the Pilbara.

In addition, forecasts expect RIO to have lifted group production by 5% YoY in 2016, with strong gains in Copper (3%), Iron Ore (6%) and Aluminium (10%).

We also expect RIO to lift group production forecast by a further 7% for calendar year 2017.

In FY17, we expect revenue to up 5% to $37b, net profit up from $5.2b in FY16 to $7b in FY18. EPS will increase from $2.90 in FY16 to $4.00 in FY18, helping to push the dividend yield from the current 3% to almost 5% in 2018.

We’re keeping exposure to resources and selling tight covered calls 5% above current market valuations.

Chart – RIO

Key US Data: Retail Sales

US economic data will dominate Friday’s trade with the release of retail sales figures before the open of the US stock market

Consensus forecasts expect the Commerce Department to announce retail sales rose 0.7% in December following a 0.1% increase in November. In the USA, consumer spending accounts for 70% of  GDP growth which makes this report a closely watched indicator of overall economic activity.

Earlier this week, the ABS announced Australian retail sales rose by .2%, missing expectations for the first time in four months.

Dow Jones – Eve of US Bank Earnings

As investors we rarely need to take much notice of intra-day graphs. However, I’ve attached the Dow Jones 5-day graph which shows the price behaviour rolling over, heading into tomorrow’s bank results.

Short-term traders and index investors, (both long and short), will find the chart and strategy outline shown below of interest. As too, would someone running a dynamic portfolio hedge using futures, index options, etc.

The chart pattern shows the recent “lower high and lower low” selling pattern as the index hit resistance just below 20,000. This big number has little relevance to us and is of no real interest. What’s more interesting is the pattern leading into tomorrow’s US bank earnings.

Traders may form a view that staying short the index as long as the price pattern stays below the 19,980 level is warranted.

From an investor perspective, we remain cautious of global markets based on current valuations and increasing macro risks. We continue to position defensively and use covered calls to deliver returns without pursuing an overweight “growth” portfolio allocation.

Chart – Dow Jones