Algo Engine – Buy Signals
We continue to track the following names as preferred recent buy signals from our algorithm engine.
We continue to track the following names as preferred recent buy signals from our algorithm engine.
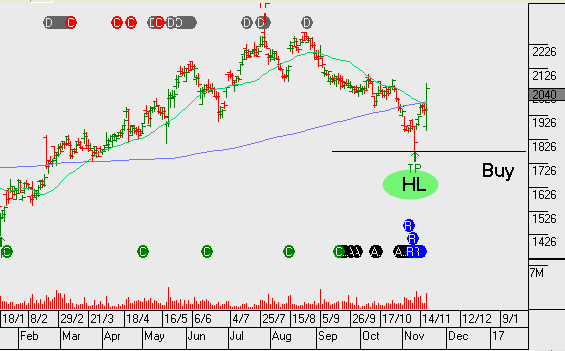
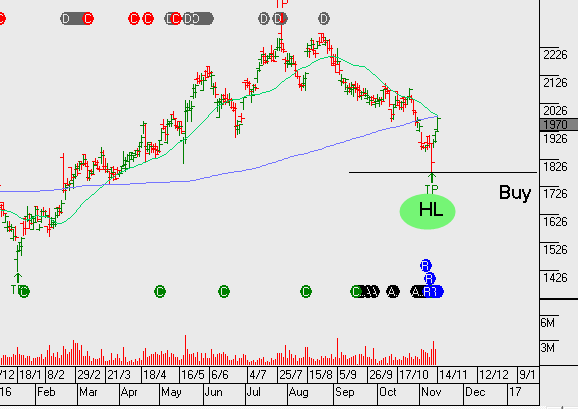
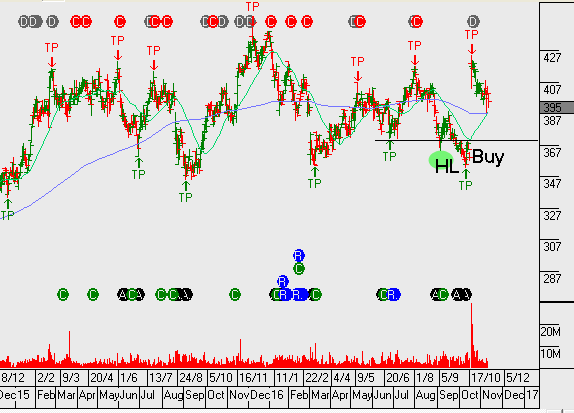
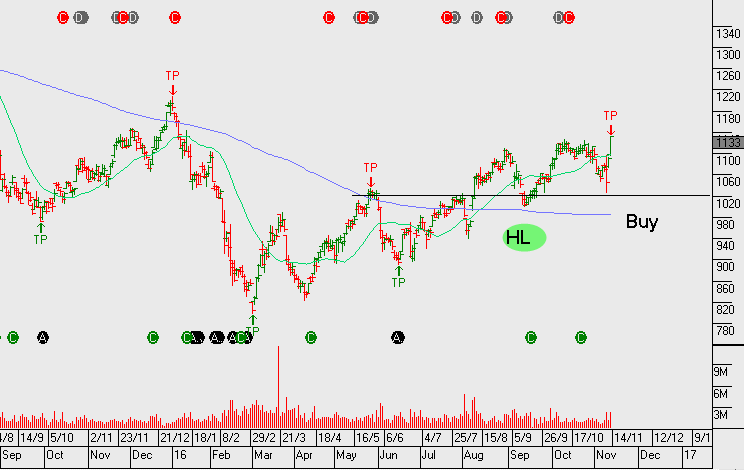
James Hardie half year (ended 30 September 2016) earnings show net operating profit of US$141m, an increase of 10% on the same time last year. Group Adjusted EBIT for the half US$204 million, also up 10% on last year.
The James Hardie earnings update supports our view that JHX remains well positioned to benefit from the ongoing recovery in US housing construction.
Overnight, US housing Starts data was released. On an annualised basis, October data showed 1.3m in October compared to expectations of 1.1m. Building Permits annualised 1.23 in October compared to expectations for 1.2m
FY17 revenue US$2b, EBITDA US$470m, EPS US$0.60 and DPS $0.44, placing the stock on a forward yield of 3%. We expect EPS growth of 10%+ in to FY17 and FY18.
Our algorithm engines triggered a buy signal earlier this week.
Sorry, but this content is restricted to our members.
Please login with your account or register for a free trial. If your trial has expired, then you may renew it here.
If you are having an issue with your account, then please get in touch with us.
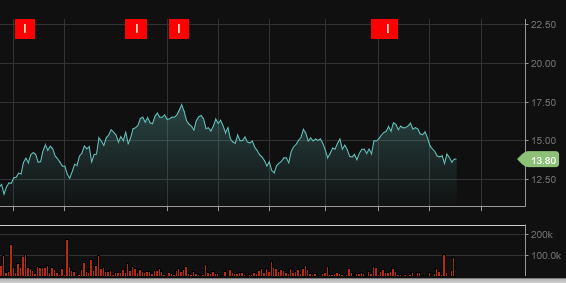
Oil prices surged overnight as investors speculate that OPEC members will push toward securing a deal to cut output. West Texas Intermediate Crude oil rose 5.8%.
As an introduction to our ETF Watch commentary, we’re looking at the BetaShares Oil ETF listed on the ASX under the code OOO.AXW. The ETF provides investors with a “pure play” to take a view on oil prices. It aims to track the performance of an index (before fees and expenses), that provides exposure directly to crude oil futures.
In addition, as oil is priced in USD the fund hedges its USD exposure back to AUD, which reduces currency risk for Australian investors.
At a company specific level, we continue to like OSH, ORG and note the recent positive momentum in STO following China’s Hony Capital increasing its share holding.
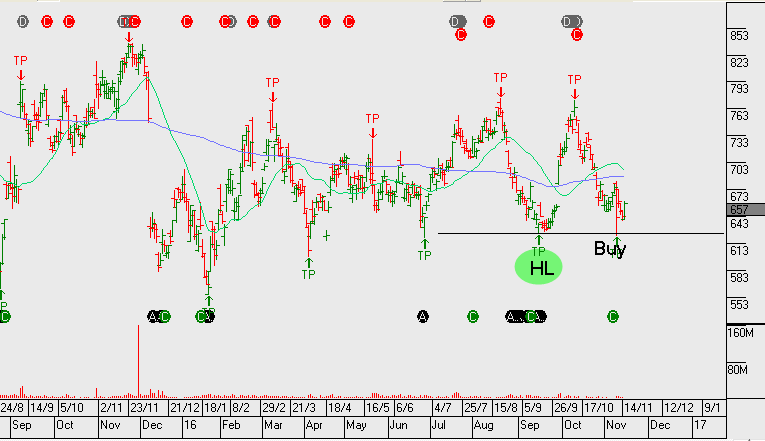
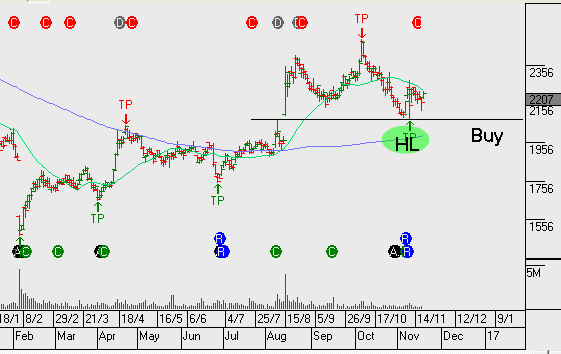
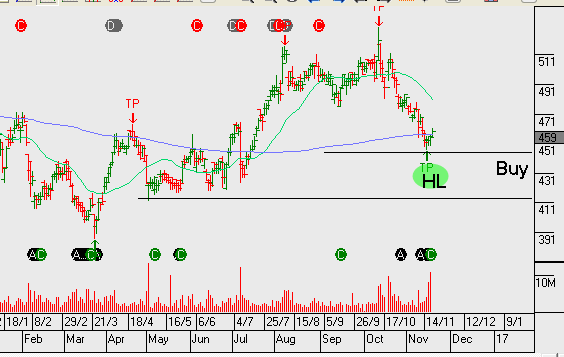
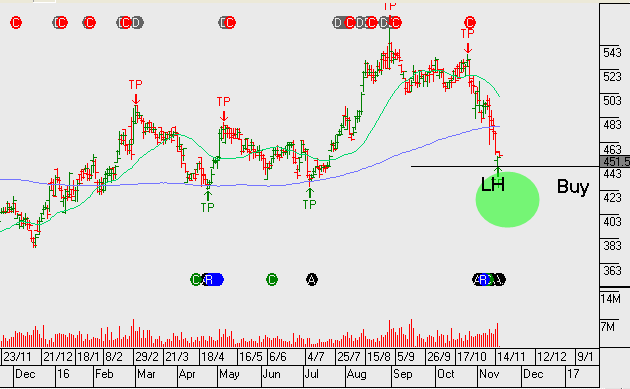
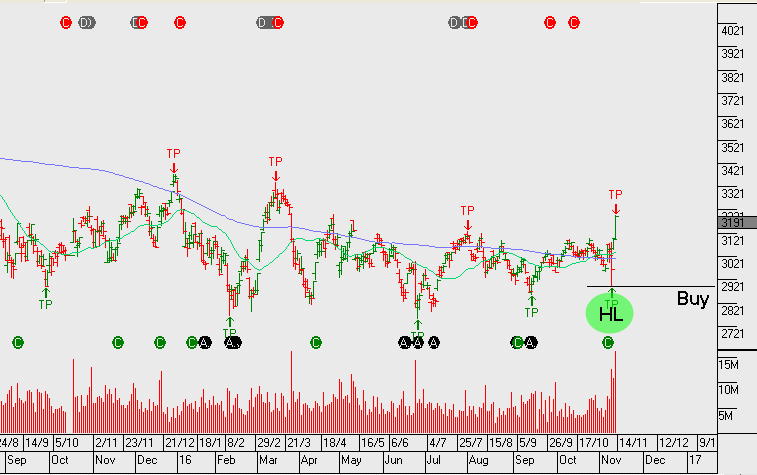
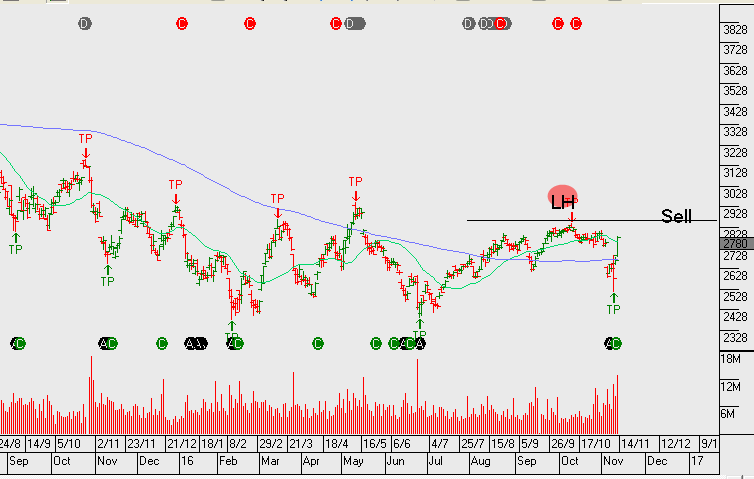
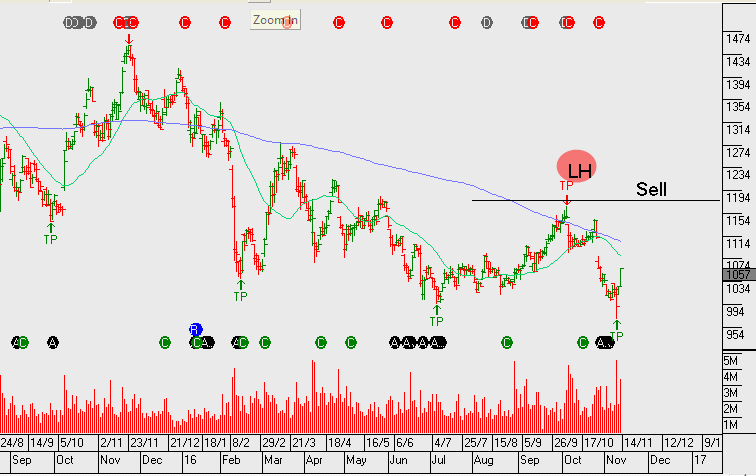
Harvey Norman and JB Hi-Fi have sold off recently and now reflect at a “higher low” price formation within a broader uptrend. Our algo engine has triggered buy signals on both of these names, so we will take this opportunity to look a little closer.
Harvey Norman reported a solid Q1FY17 trading update, yet the share price has sold off over 15% following questions being raised over the group’s accrual accounting practises. The strong history of free cash flow generation should begin to dampen investor concerns and lift share prices.
FY17 revenue is likely to be up 7% year-on-year to $1.9b, EBITDA $650m and NPAT $375 which will be up 10% on FY16, placing HVN on a forward yield of 7%.
Momentum studies suggest HVN is worthy of consideration: FY15 to FY16 EPS growing by 25% or from $0.24 to $0.30 per share.
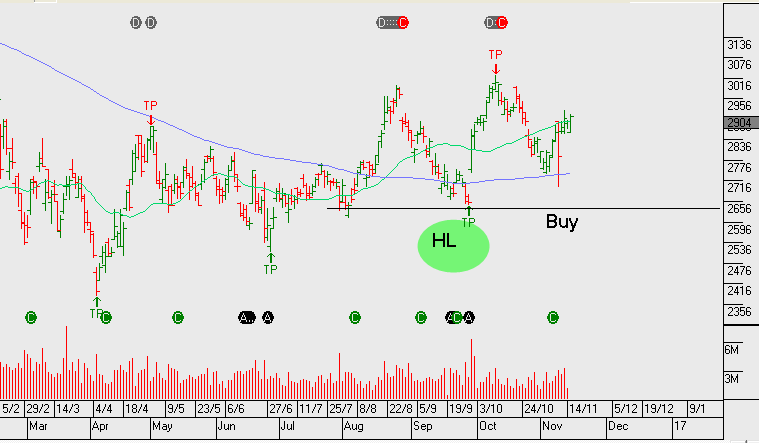
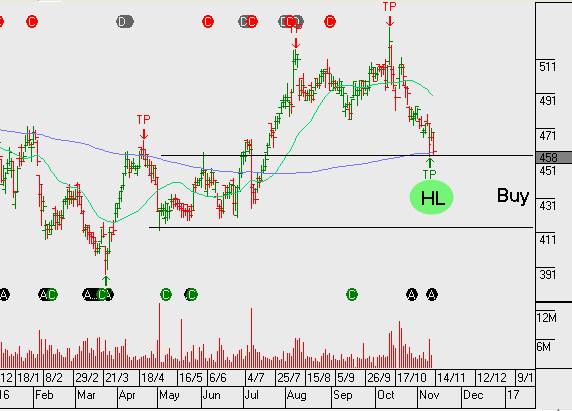
We recently highlighted James Hardie as a buy recommendation and we therefore draw your attention to the upcoming 2Q earnings result scheduled for release on Thursday.
Consensus expectation for FY17 net profit is around US$275m. This will mean JHX is delivering 15%+ EPS growth. It’s likely that a positive earnings trend can be supported by stronger demand for its products from North American consumers.
FY17 revenue $2b, EBIT $400m, NPAT $275, EPS $0.65, DPS $0.44 places the stock on a forward yield of 3%
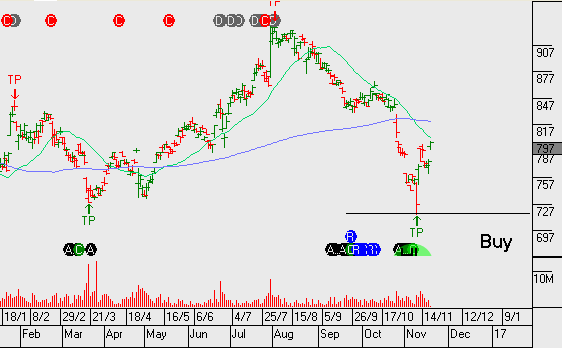
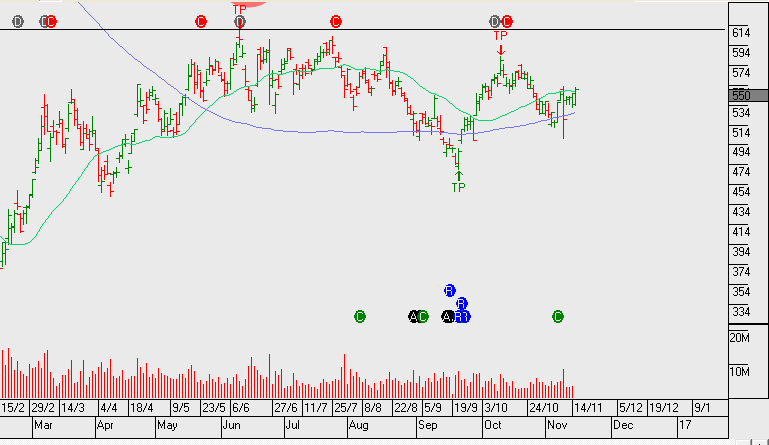
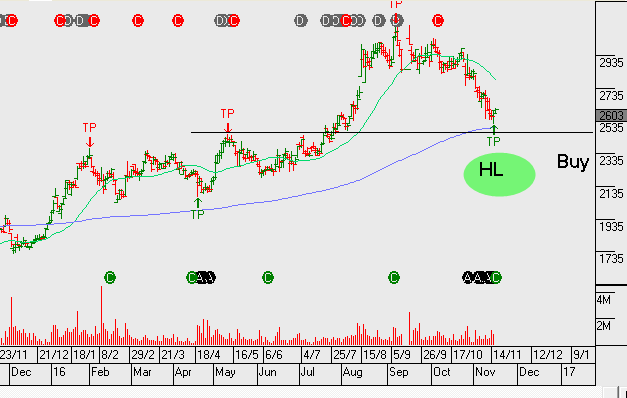
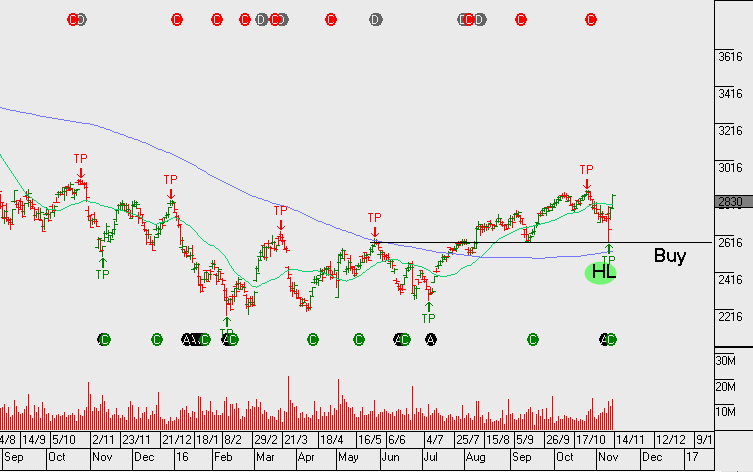
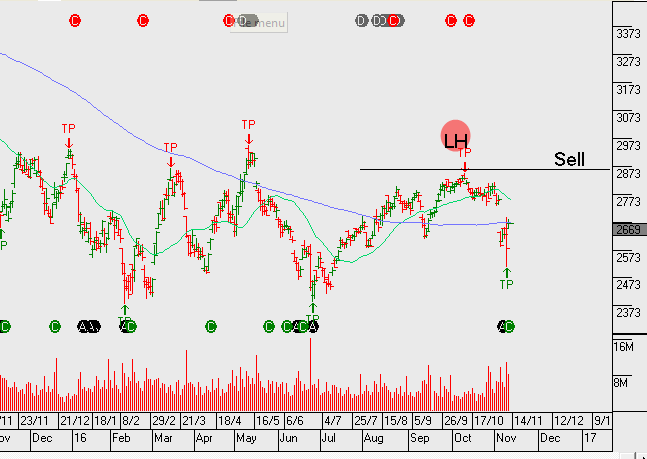
Strong competition is likely to subdue 1H17 earrings growth for TABCORP.
The 5% sell-off the stock has had over the last two weeks sees TAH trading back into our value range and the stock is now producing a buy signal from our algorithm engine.
The announced merger on the 19th of October between TABCORP and Tatts Group along with the $500m share buyback, should help to underpin the share price.
FY17 revenue $2.2b, EBITDA of $550m, EPS of $0.24 places the stock on a forward yield of 5.5.
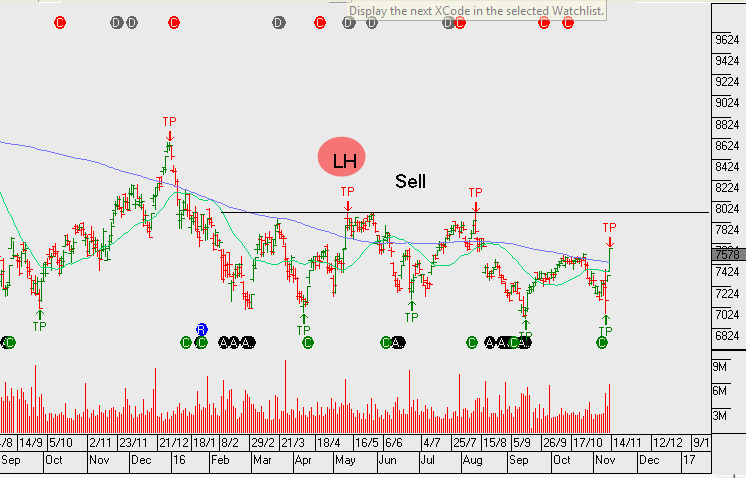
We now have ANZ and WBC creating a higher low formation. However, CBA and NAB still remain below the recent highs within the downtrend that’s been in place since May 2015.
Back in August, ANZ was the first to break the downtrend and now WBC has followed. Within the regional banks, between BOQ and BEN, it’s Bendigo that’s displaying a more bullish price pattern.
Although the breakout in financials is strong at present, we don’t see too much further upside. As reflected in the recent earnings results, the banks are having difficulties growing top line revenue. Our largest bank exposure in client portfolios is Westpac. We’ve left this name uncovered at present, however, it’s likely we’ll identify a point this week to add covered calls to enhance the yield.
ANZ goes ex-dividend $0.80 on Monday & WBC also goes ex-dividend $1.00 on Monday.
National Australia Bank delivered 2H16 earnings which showed strong organic capital generation and underlying earnings trends that were relatively strong compared to their banking peers. In addition, it’s also worth noting that the SME business segment is showing early signs of a pickup in credit growth; this is an area where NAB has traditionally led its competitors.
NAB trades on almost a 10% discount to its peers and we may begin to see scope for this discount gap to close.
Consistent across all the major banks, we continue to see mortgage margins under pressure. This remains a concern, especially for Westpac and CBA as they’re likely be impacted the greatest by declining mortgage margins.
NAB FY17 underlying profit is expected to be $10b on EPS of $2.30 and DPS of $1.70 placing the stock on a forward yield of 6.5%.
Financials globally are getting a boost following the US election, however, we remain cautious and look to sell call options into the rally.
The following group of stocks are in either established uptrends or, in recent months they’ve broken downtrends to begin building the early stages of a bullish “higher low” formation.
Many of these names have been mentioned previously in the blog and/or the monthly strategy video report. It’s worth loading these codes into your watch list and considering rebalancing your portfolio to include allocations towards some, or all of these names:
JHX, LLC, MQG, SHL, TWE, ANN, ANZ, ASX, CCL, CIM, COH, QUB, TAH, WOW & WPL.
With the lower growth names within the above basket, such as WOW & CCL, we compliment the position now with tight covered calls to enhance the yield to 10%+ per annum. With some of the other names, we give a little more breathing space as we expect 5 to 10% price appreciation before selling the call option overlay.
Level 17 Chifley Tower
2 Chifley Square
Sydney, NSW 2000
1300 614 002
Investor Signals Pty Ltd
ABN 44 143 555 453