Death of the high PE

We’ve been warning about a number of ASX large cap stocks which trade on 25X earnings and 2% yield and, at best, will deliver low single digit earnings growth.

Two examples are the recent sell signal posts we’ve made on Computershare and James Hardie.

We feel that the day of reckoning is approaching and, in many instances, as seen in CPU & JHX, the selling has already started and we’re now seeing a retracement back to the mean, (and likely beyond).

We’ll leave the 150x PE of Amazon, or the 200x PE of Netflix for a future  posting, but suffice to say; reality will soon hit.

Chart – CPU
Chart – JHXASX:JHX


Black Monday 2011, Revisited

Just over  six years ago, August the 2nd 2011 to be exact, the US Congress avoided a Sovereign default and finally reached an agreement to raise the US debt ceiling from $14.29 trillion to  $15.77 trillion.

The legislation was called the “Budget Control Act of 2011”, and was signed on the same day by President Barack Obama.

During the negotiations, credit agencies, Moody’s, Fitch and Standard and Poor’s all advised lawmakers that the US AAA credit rating was going to be reviewed regardless of the debt ceiling legislation.

After the market closed on Friday, August 5th, several rating agencies downgraded the US credit rating to AA+ .

This triggered a massive selloff on Monday, August 8th,  where The NASDAQ Composite Index fell 174.72 points (-6.90%), the SP 500 Index shed 79.92 points (-6.66%), and the Dow Jones 30 Index lost 634.76 points (-5.55%).

The aggregate loss on the day was over $1 trillion.

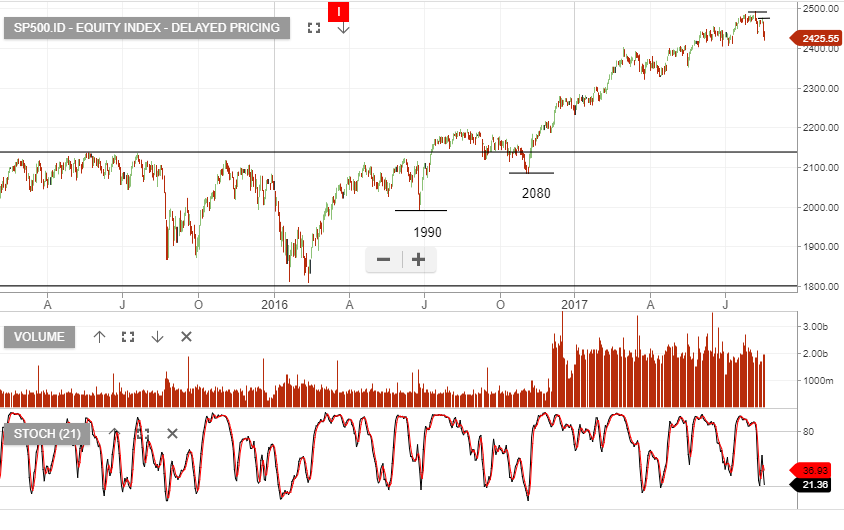
As the chart below illustrates, the fall out from the 2011 debt ceiling crisis led to the SP 500 losing 208 points, or 16.1% in just 6 trading days.

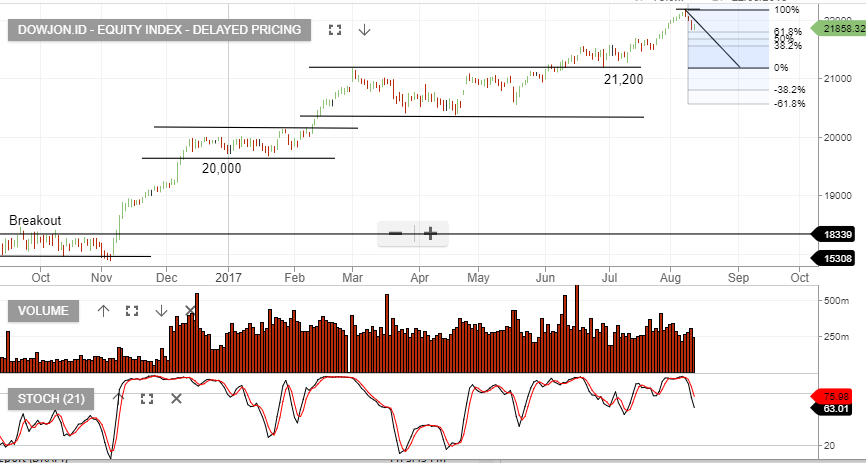
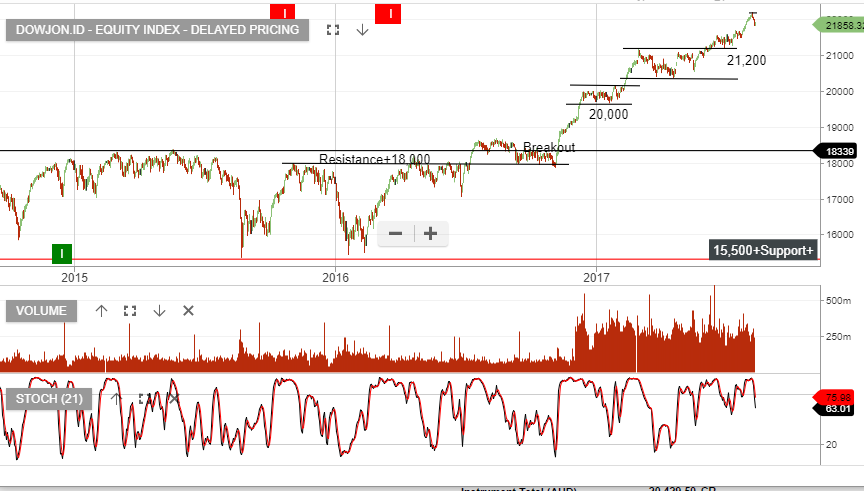
The US Congress and the White House have already commenced discussions about raising the debt limit from the current level of $19.80 trillion, with a September 29th deadline.

Considering the market’s inflated valuations based on tax cuts and infrastructure spending, domestic issues with consumer credit and autos loans, and the escalation of geopolitical risks, we suggest caution that this time the US equity market sell off could be much greater.
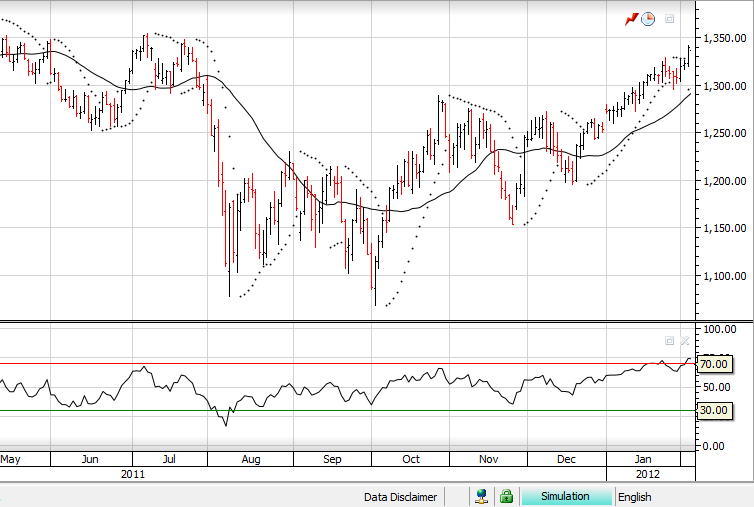
 

SP 500 August 2011.


Chart Update – Dow Jones Index

The chart below of the Dow Jones Index illustrates the selling pressure that is now building, in what has to be viewed as an overpriced market, relative to the risks which lie ahead.

The short-term momentum indicators have turned negative and we remain cautious on banks, property developers, consumer discretionary & companies that are trading on bubble level PE ratios.

Chart – Dow Jones
Chart – Dow Jones


Algo Sell Signal – Goldman Sachs & General Electric

Our Algo Engine has triggered a sell signal in Goldman Sachs.

We maintain a negative outlook and advise running a stop-loss should the price action trade above the signal high of $235.

Chart – GS

Following the Algo Engine short signal in General Electric, the price action continues to carve-out lower levels.

Should we see GE trade down to $22, we would consider this price target as an oversold and  providing a suitable entry point for new long exposure.

Chart – GE


US Credit Card Defaults On The Rise

US media reports suggest the US economy is flashing a warning sign that could mean US is headed for a downturn.

Credit card companies are starting to grow nervous as the net charge-off rate, or the percentage of loans that credit card issuers write off as a loss, has just hit its highest level in four years, a continuation of several quarters of the rate rising.

The trend hit all major card issuers and is starting to eat into bank earnings. The current rate is 3.29%, but it is still a long way from the peak hit in 2010 of 10%.

The rate had dropped for 24 straight quarters during the recovery, until a reversal in recent quarters.

The “cause and effect” logic is that once credit card defaults begin to rise, the default rate on mortgages also begins to rise, which is a much bigger problem for the US economy.

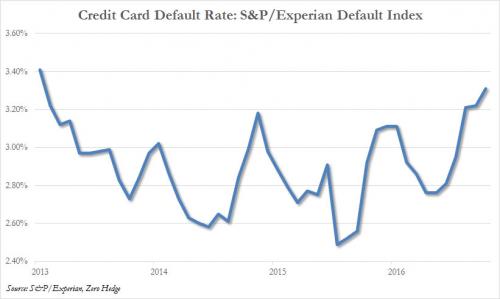
Credit Card Default Rate  
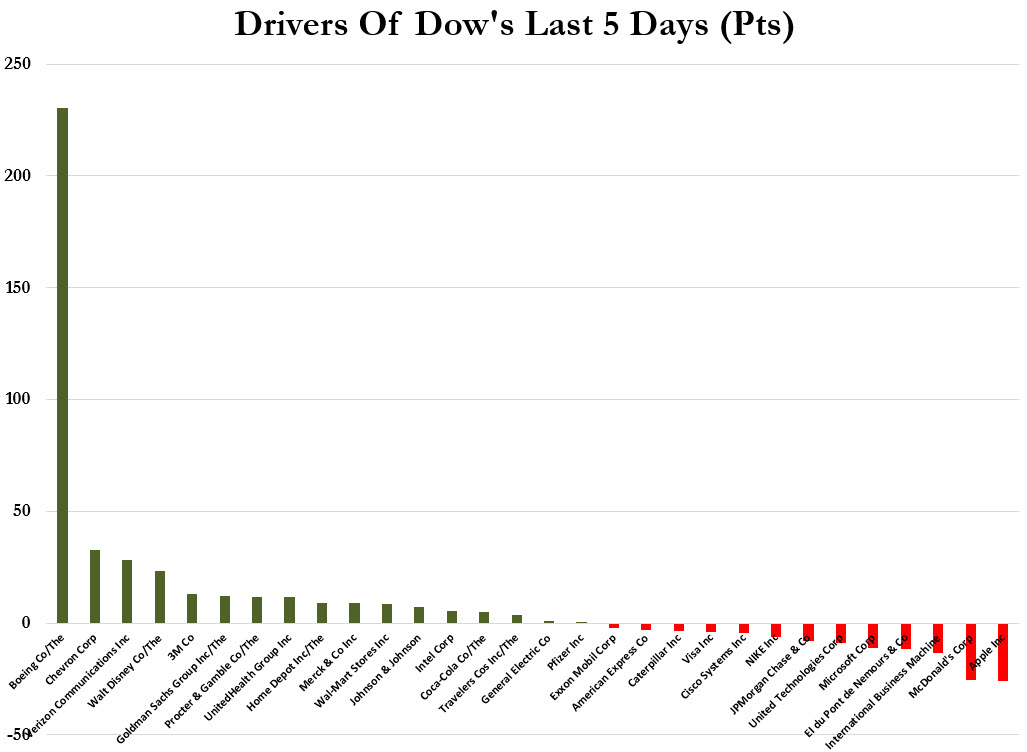
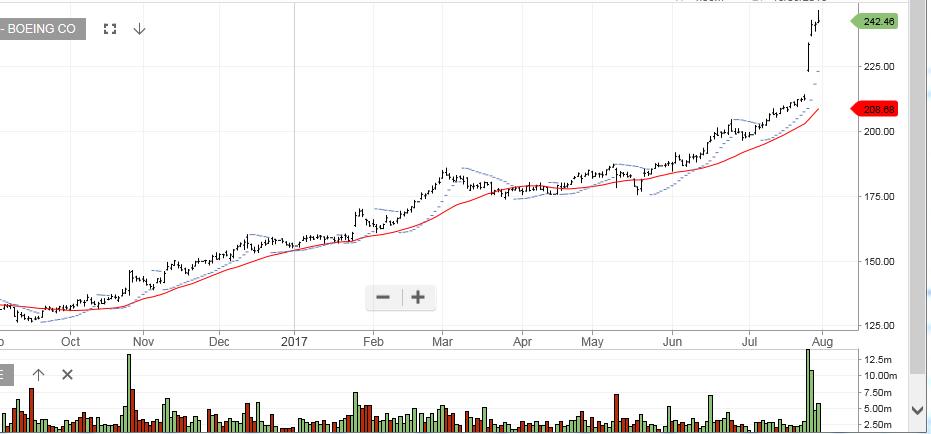
 

Boeing Lifts The Dow In July

The Dow Jones 30 Index posted its 5th consecutive new record high close today at 21,891.

During the month of July, the Index gained 570 points, or 2.6%.

As the chart below illustrates, 310 of those 570 Dow points were generated by one stock: Boeing.

Boeing shares climbed over 24% during the month of July from $197.75 to $246.00. In just the last 5 trading sessions, Boeing shares rose 16% from $212.50 to $246.00.

Since the Dow is a price-weighted Index, a higher point value, or Beta, is assigned to higher priced stocks.

Boeing

Google Shares Drop On Lower Income

Shares of Alphabet, parent company of Google, are down over 3% to $967.00 in aftermarket trade.

After the close of trade today, the tech giant posted a 27.7% drop in quarterly profit compared to a year ago.

The company beat expectations on both the top and bottom line with earnings of $5.01 per share on $26 billion in revenue, compared to earnings of $4.49 per share on $21.5 billion a year ago.

However, a dip in net income from $4.88 billion a year ago to $3.50 billion this quarter offset the better-than-expected earnings.

Our ALGO engine triggered a buy signals on Alphabet on June 30th at $908.00. We will look for initial support at or near the $945.00 level.

Alphabet (Google)