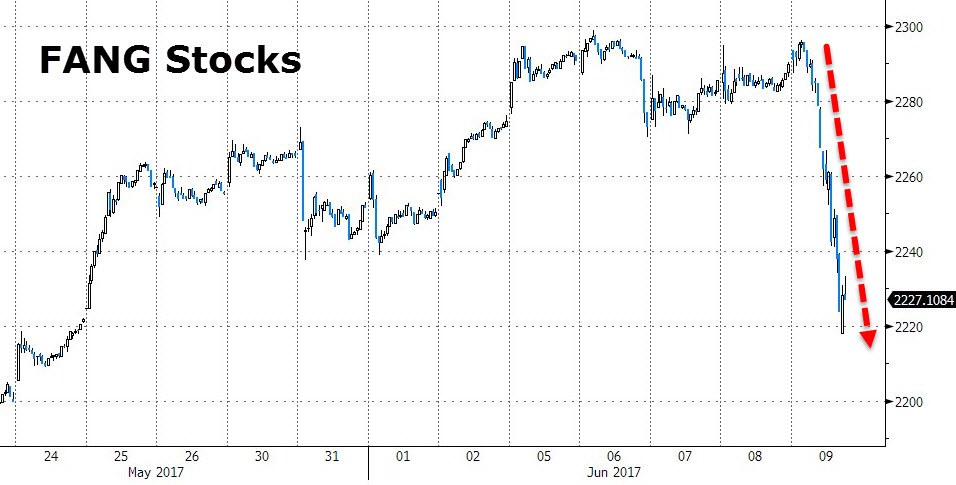
Big Reversal In The FANG Stocks

Shares of Facebook, Amazon, Netflix and Google (also known as the FANG stocks) all fell over 3% today as investors pulled money out of the overheated US Tech sector.

The FANG stocks have been market leaders all year and have accounted for over 40% of the NASDAQ gains year-to-date. On a valuation basis, these names have added over $600 billion to the S&P 500 even though they only make up 13% of the index.

Many analysts have been expecting a pullback in the tech sector as P/E ratios and forward guidance data have approached the levels last seen prior to the 2000 and 2008 market corrections.

It’s worth noting as a point of reference that Microsoft, which is not a FANG stock, fell 62% after the 2000 tech bubble burst and dropped 45.5% during the financial crisis in 2008.

Even after today’s sharp decline, the S&P tech sector is still up over 18% for the year.

US Stocks Trade Higher On Weak Jobs Report

The US unemployment rate unexpectedly fell to 4.3%, a new multi-year low, but it is a misleading statistic for what was a very disappointing overall report.

Besides the decline in the unemployment rate, and a further decline in the under-employment rate (U-6) from 8.6% to 8.4%, there is little positive in today’s report.

Non-farm payroll growth fell to 138k, nearly 50k below expectations, which had been bolstered by the weekly jobs claims and the ISM jobs component.  Adding insult to injury, the back to months saw jobs growth revised 66k lower than first reported.

Moreover, the drop in the unemployment rate can largely be explained by the decline in the participation rate from 62.9% to 62.7%. This unwinds this year’s improvement in the participation rate, and bring it back to where it finished last year.

The  major stock indexes finished higher on the day, on thin volume, as the odds of a third rate hike for 2017 have been reduced

ETF Watch – IVV ETF (S&P500)

The IVV ETF is based on the S&P500 index in the US, the chart shows the market remains in a bullish higher low structure.

Investors continue to chase equity valuations higher as US GDP deteriorates.

Chart – IVV

The chart below is the BetaShares NASDAQ 100 ETF. Our Algo Engine triggered a buy signal in early 2016 when the ETF was trading at $10, it is now trading $13.50.


Lockheed Hits All-Time Highs On Saudi Deal

Shares of Lockheed Martin (LMT) reached an all-time high of $280.00 as the defence contractor agreed to a deal with Saudi Arabia worth $28 billion.

This deal alone is enough to cover the company’s revenue for over 6 months

LMT is one of the key beneficiaries of a total arms package which will be worth over $350 billion over the next 10 years.

Among other products, the deal includes the sale of 150 Black Hawk helicopters, systems for air defence, tactical aircraft and combat ships.

Lockheed Martin

Chart Watch – Goldman Sachs

Goldman Sachs has sold  off $40 since the high created on the 1st of March. The chart image below shows price action is now finding minor support within a weakening short-term channel.

We’ll continue to watch the chart pattern unfold with anticipated resistance back up at $230.

The relevance of tracking GS for local investors, is it may provide an indication  as to when our local banking & finance stocks will find new selling pressure, should they have a minor bounce from yesterday’s lows.

Chart – Goldman Sachs


ETF Watch – IVV (S&P500)

The IVV is an iShares ASX listed ETF that provides exposure to the S&P500 index of stocks.

Our Algo Engine has triggered multiple buy signals over the past 3 years and so far, no sell signals. However, with the index at 18x earnings and deteriorating global economic data, we feel now is an opportunity to lock-in gains and wait for the next Algo Engine buy signal.

Chart – IVV


US Equities & Bonds

The US 10 YR treasuries  have fallen from 2.62% yield, to now trading at 2.23%. US economic data is deteriorating and the bond market is suggesting that a June rate hike is now less probable.

Lower bond yields make it more difficult for banks to expand their net interest margins.

The following graphs show the recent trends in GE and Goldman Sachs. We’ve been following GE since January as a leading indicator of the headwinds facing global industrial companies.  We’re now seeing this weakness manifest in the beginning of a more broad based equity market sell-off.

Chart – GE
Chart – Goldman Sachs