Goldman Sachs – Q1 17 Earnings Result

Goldman shares dropped more than 5 percent overnight to trade at their lowest since the end of November and are down 10 percent for the year so far. The US financials sector is about 1 percent lower year to date

Goldman Sachs reported 1Q earnings per share of $5.15 a share, missing a consensus estimate by 16 cents. Revenue came in short by about $420 million at $8.026 billion.

The last time Goldman reported a miss on earnings per share was the fourth quarter of 2015.

Technical buying support may start to build at or near $200.

Chart – Goldman Sachs


JP Morgan Slips 1% After Q1 Earnings Report

Shares of JP Morgan fell over 1% today as their Q1 earnings report included a sharp increase in write-downs.

The company reported earnings of $1.65 per share, which was up from an adjusted $1.35 reported a year ago and higher than the street estimates of $1.52.

However, concerns emerged in the bank’s consumer group, where credit costs surged to $1.4 billion, up almost $400 million from Q4 2016. This expense was driven by higher credit card charge offs.

As the other major US banks report their earnings next week, we will watch for similar write downs as a source of selling pressure.

JPM shares closed at $84.40, which is over 11% lower than the $94.00 high posted on March 1st.

US Payroll Preview

The US Non-Farm Payroll data will be released at the start of today’s NY session. With US Stocks reacting negatively to the news of the FED’s plan to begin reducing their balance sheet, attention will be focused on the interest rate aspect of the report.

The consensus headline number is expected at 174,000 new jobs with Hourly Earnings expected to climb by .2%.

The cause and effect logic to the data will be that a stronger report would be negative for stocks, since it would support the odds of another rate hike in June.

Both the DOW 30 and SP 500 indexes are trading below their 30-day moving averages and could extend lower on stronger data. We see downside support at 20,300 and 2315, respectfully.

A large miss in the data would likely lift US stocks on the notion that the FED will remain on hold until August.

Dow Jones – Key Chart Signals

The Dow Jones has found short-term support in the higher low structure at 20,412. A break below this in the next day or two will be negative for US equities.

For the time being, we’re seeing buy signals from the Algo Engine in some of the beaten-down key US financials, Goldman Sachs, JP Morgan, Morgan Stanley & and Bank of America.

Chart – Dow Jones
Chart – Goldman Sachs
Chart – JP Morgan
Chart – Morgan Stanley
Chart – Bank of America


US Update: Trump Puts Healthcare Reform On Hold

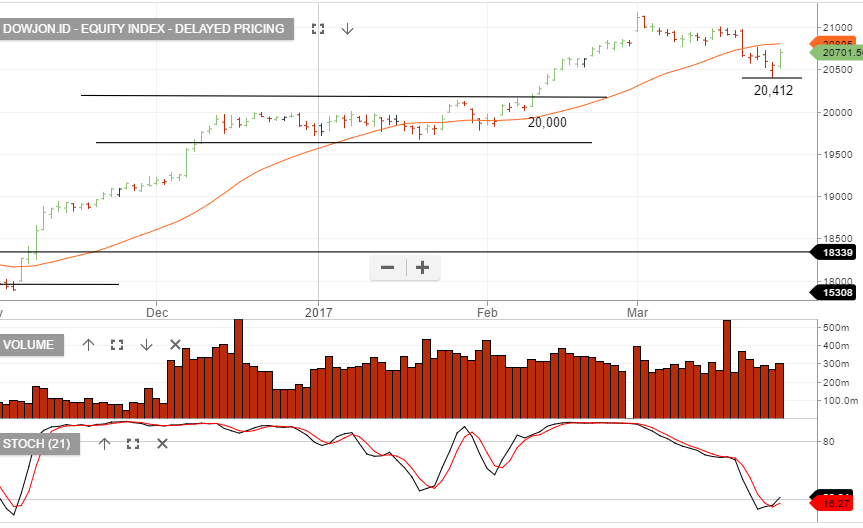
US Stock Indexes finished the week mixed as many investors were focused on how the House of Representatives would vote on the administration’s bill to repeal major parts of the current health care program, referred to as Obamacare.

As the day progressed, the DOW and SP 500 swung between positive and negative territory as news reports gave conflicting stories about whether the bill would pass, or even be voted upon.

In the end, after Mr Trump’s ultimatum failed to yield more “yes” votes , the embattled bill seeking to start the healthcare reform process, and free up almost a trillion dollars in tax dollars, was pulled from the floor.

As a result, Mr Trump suffered a second consecutive blow from within his own Republican party. This party dissension will likely cast doubts on the President’s ability to deliver on other policy measures including; tax reform, infrastructure spending and the debt ceiling legislation.

The announcement that the vote was cancelled happened too late in the day to have any material impact on today’s trade.

However, going into next week, investors will have to address the question of how Mr Trump can now unify his own party behind his administration; and whether this legislative defeat will “deflate” the “reflation” trade, which was triggered after he was elected?

Algo Signal – US Financials

With the recent sell-off in US equities, we’re now seeing a number of Algo long signals appear in the US financial names.

We’re mindful of the “peak optimism” that is priced in regarding tax cuts, deregulation & US economic pickup and approach these buy signals with caution.

We’ll be tracking the short term momentum indicators in Goldman Sachs and Bank of America as a leading indicator to market sentiment.


Chart – GS
Chart – Bank of America


Heavy Losses On Wall Street

Both the DOW Jones 30 and SP 500 index fell over 1% today during the worst trading session for 2017 for US Blue-Chip stocks.

Banking names led the hefty losses, with the DJ Banking Index trading back below the 50-day moving average.

Dow/SP component Goldman Sachs lost almost $10.00 on the day and is now 10% lower than the March 1st close of $253.00.

A confluence of lower loan growth, political uncertainty and extended valuations pressured the banks, as well as the general market, lower on very high trading volume.

Technically, both the DOW Jones and the SP 500 have posted their first close below the 30-day moving average since November 7th.

The unwinding of the overbought conditions in many of the index components will likely be a process more than an event.

With the banking sector very heavily weighted in the ASX 100, this process will likely pressure Australian names lower, as well.

Investors who are looking to hedge their portfolios or profit from a down move in the ASX can trade either the BetaShare  BBOZ  or BEAR Exchange Traded Funds.

These are inverse funds which gain value as the ASX index trade lower. Please call for more information.