Shares of Chevron lost over 2% today to $113.80 as the energy giant reported Q4 earnings results which missed estimates by a wide margin.
The company announced Q4 EPS of 22 cents per share, on revenue of $31.5 billion. Analysts had expected the firm to report EPS of 64 cents per share on revenue of $33.3 billion.
In the year-ago period, Chevron reported a loss of $588 million, or 31 cents per share just as crude oil prices were hitting a 12-year low near $27.00.
We expect Chevron’s share price to closely track the price of crude oil going forward, and would look for the next area of support to be near the November price breakout range of $105
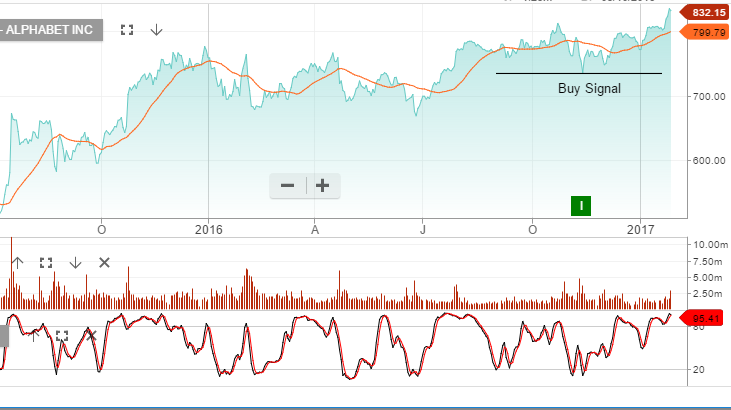
Shares of Alphabet, the company formerly known as Google, fell over 3% as their Q4 EPS announcement fell short of the street’s expectations.
The search-engine giant posted earnings of $9.36 per share on expectations of $9.64. The company generated $5.33 billion in net income, which was up 8.3% against the same period last year. Revenues for Q4 were $26.06 billion, up 22% from last year.
We expect to see initial support for Google to be found in the $820.00 area.
Chart – Google
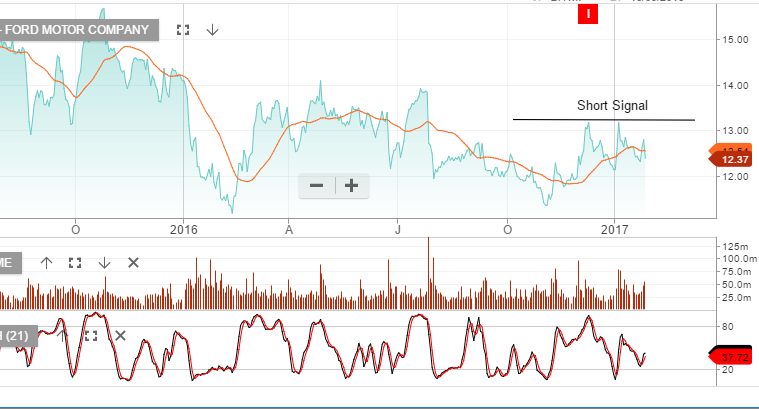
Ford Motor Company reported Q4 and full-year 2016 earnings earlier today, and the automaker missed by a narrow margin.
Ford’s Q4, earnings were $0.30 per share. Analysts had expected $0.31 per share.
Revenue for the quarter was $38.7 billion, higher than expected. For the full year 2016, revenue was $151.8 billion, and net income was reported at $4.6 billion, down $2.8 billion from a year ago.
The stock has risen 8% in the past three months but fell 3% today to close at $12.30.
Our Algo Engine triggered a short signal on the 9th of December at $13.20. Momentum continues to look weak.
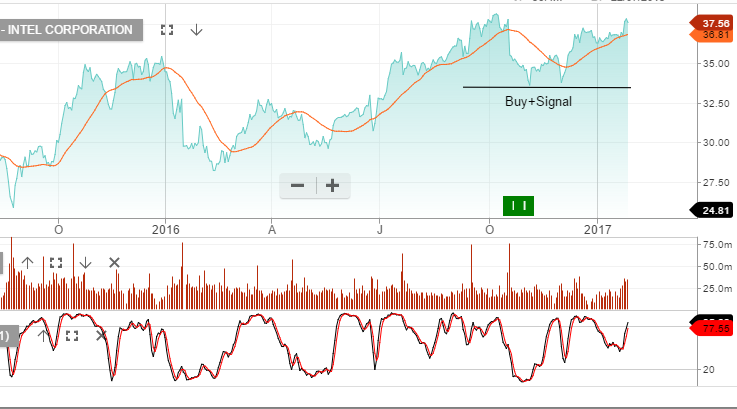
Shares of Intel traded over 3% higher and nearly reached a new five-year high of $38.00 as Q4 earnings and revenue both beat analysts’ expectations.
The chip-maker posted Q4 EPS at 79 cents per share on quarterly revenue of $16.37 billion. The street was expecting EPS of 74 cents on revenue of $15.75 billion.
The key growth sector for the firm has been the data center group, which posted an 8% year-over-year increase to $4.7 billion.
We view the growth prospects for Intel favorably and look for a price target of $46.00 over a 3-month horizon.
Shares of aerospace giant, Boeing, gained over 6.5% and traded at an all-time high of $168.65 as the firm announced better-than-expected Q4 earnings.
The company reported Q4 earnings of $2.47 per share versus analysts’ estimates of $2.32 per share. On the revenue side, Boeing announced $23.3 billion against expectations of $23.1 billion.
Even though revenue from military orders fell by 18% from the same quarter in 2015, the company still said that it delivered 926 commercial and defence aircraft over the full year.
The company’s outlook for 2017 EPS came in at $9.10 to $9.30, with the top end of this range reflecting a 6% decline from FY 2016 EPS of $9.90 per share.
This lower forward guidance will likely temper further gains beyond the $172.50 level.
Shares of AT&T ended the day flat after Q4 earnings were roughly in line with the street’s expectations.
The company announced Q4 adjusted earnings of 66 cents per share on revenue of $41.8 billion, which was slightly lower than the year-earlier revenue of $42.1 billion. Analysts were expecting earnings of 66 cents per share on revenue of $42.04 billion.
The brightest spot in the report was that AT&T added 200,000 paid subscribers to it DirectTV streaming entertainment service during Q4, which brings the total number of subscribers to just over 21 million.
Shares of AT&T have been trading in a pennant formation over the last 12 months with resistance in the $43.00 area and support in the $36.00 area. Shares closed today at $41.30.
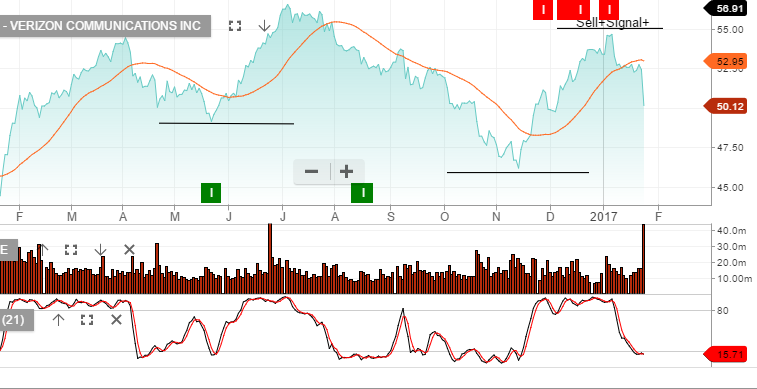
Our Algo Engine flagged a short signal in Verizon at $55 on the 5th of January. The stock in now off 10% and it was the largest move to the downside within the Dow Jones top 30 stocks in the overnight session.
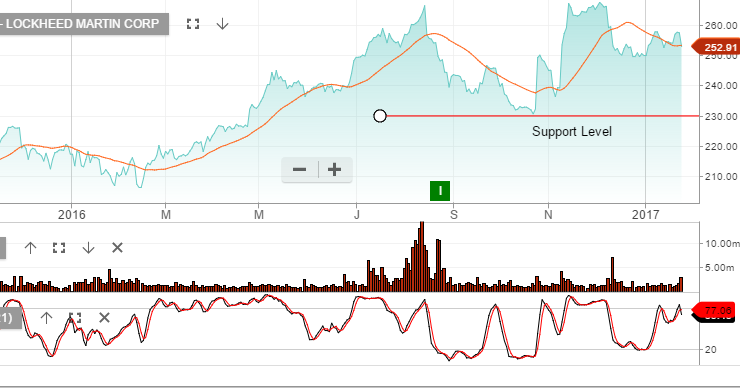
Major Defence contractor Lockheed Martin reported Q4 earnings of $3.25 per share, surpassing the street’s estimate of $3.04 by almost 7%. Full year earnings of $12.38 also beat the consensus of $12.18 and improved by 24.7% from the year-ago level.
Q4 revenue was announced at $13.75 billion , beating analysts’ expectations of $13.09 billion by 5%. Total 2016 revenues were reported at $47.25 billion, up 16.6% on a year-on-year basis and above the street consensus of $46.46 billion.
For 2017, the firm expects to generate revenues in the $49.5 to $51.25 billion range and expects EPS to be in the range of $12.25 to $12.55.
Despite this solid Q4 report, shares of Lockheed Martin fell 4.5% on the day to $252.00. We see scope for the price to slip lower to the November low of $240.00 over the near-term.
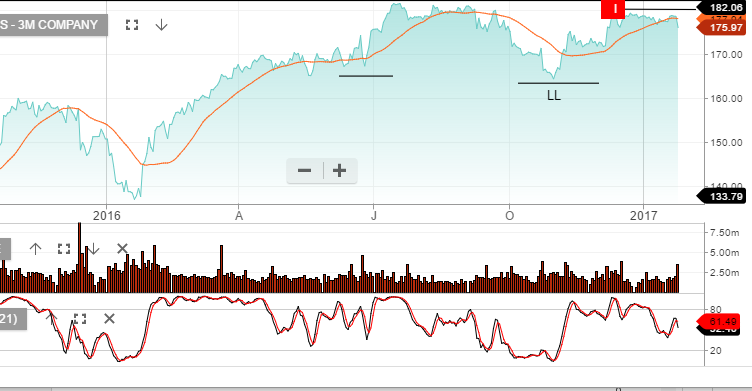
Q4 earnings for 3M printed higher, led by strength in its core industrial unit and steady overseas sales.
The maker of industrial adhesives and “post-it notes” reported Q4 earnings of $1.88 per share on revenue of $7.33 billion, compared to $1.66 per share a year ago. The firm said sales in its industrial division increased by 3% to $2.5 billion, led by automotive original equipment manufacturing.
The company also restated its previous 2017 EPS guidance to reach the $8.45 to $8.80 range.
Despite the upbeat report, shares of 3m fell 2.54% to close at $176.00. This is just 4% below the 5-year high posted in July at $181.50. We would expect good technical support to emerge back at the Mid-November lows around $170.50.
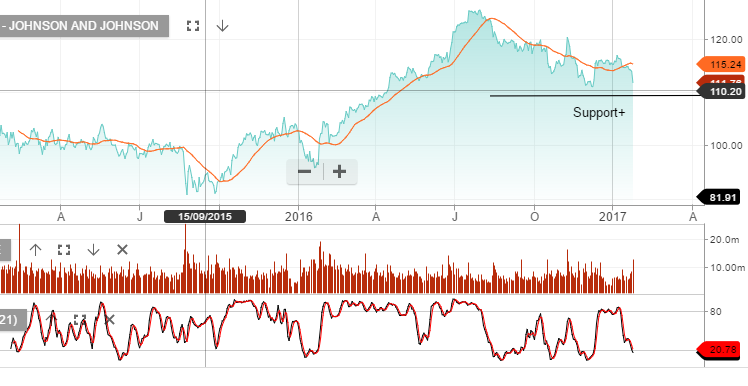
Health care giant Johnson and Johnson reported higher earnings but revenue numbers fell short of expectations.
J&J announced Q4 adjusted earnings of $1.58 per share, up 9.75 from a year ago and above the street estimate of $1.56 per share. The firm reported net earnings of $3.8 billion , which was in line with estimates of $3.81 billion.
However, Q4 revenue was announced at $18.11 billion, compared to the consensus of $18.25 billion. J&J issued sales and earnings guidance for 2017 for EPS of $6.90 to $7.10 on revenue of $74.1 to $74.8 billion.
Like many of its peers, J&J is facing generic competition and pricing pressure for some of its pharmaceutical products. As a results, shares of J&J fell over 2% to $111.70, which is close to 7% below the November high of $120.50.
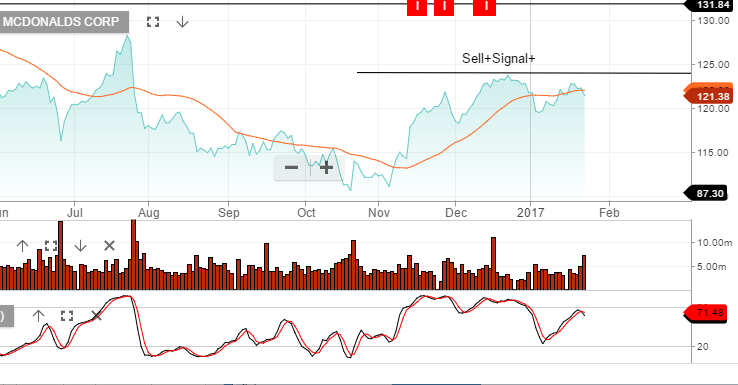
Despite a solid Q4 earnings report, shares of MacDonald’s Corporation ended the day flat at $121.30.
The fast food giant posted Q4 earnings of $1.44 per share on quarterly revenue of $6.03 billion, which represents a 2.1% increase in earnings and a 10% increase in revenue versus the same period last year.
These Q4 numbers surpassed the expectations of $1.41 per share on revenue of $5.98 billion.
The revenue numbers show a mixed result with company-owned restaurants falling 9% to $3.65 billion, while franchise-operated restaurants grew 3% to $2.38 billion.
Our Algo Engine flagged a short signal in December at $123. We’re watching the price action closely as technically the share price has seen resistance in the $123.00 area.
The Standard and Poor’s 500 index is a widely followed indicator of the general direction of the US stock market, and by extension, global equity markets.
The reason for the wide following is clear. The S&P 500 comprises 505 common stocks and covers 80% of the American equity market on a capitalization basis.
However, so far this year, the S&P 500 index has had wide intra-day ranges but has gone practically nowhere. It finished the fist week of the year near 2277 and at 2275 in the second. It finished last week near 2274.
The technical indicators are not generating clear signals with the 30-day moving average being tested over the last 4 sessions but not broken.
The prospects of business-friendly policies from the Trump administration may be helping to support the market , while fear that much of the good news has already been discounted in the market has tempered enthusiasm for new buyers.
It’s our view that this indecision pattern will be resolved as the US earnings season moves into its second full week. At this point, the risk remains asymmetrically to the downside on weaker earnings reports, versus the upside potential on better-than-expected reports.
Sophisticated Investor?
We have special opportunities available for Sophisticated Investors. If you're interested, and qualify, please provide your details below.