Algo Buy Signal – Resource Sector

With the recent sell-off in commodity names, the Algo Engine has triggered buy signals in a number of big and small cap companies.

Our preferred resource allocation remains BHP, over other alternatives. However, it’s worth taking note of the recent buy signals in RIO, FMG, IPL and in OOO, the BetaShares Oil ETF.

We look to take profit in BHP at $25, after buying at or near $22.50.

Chart – Oil


ALGO Engine Buy Signal For NAB

The ALGO engine triggered a buy signal for NAB at $30.40 on Friday.

NAB shares have dropped over 11% since posting an intra-day high of $34.00 on May 1st. Several internal momentum indicators are showing an overbought condition.

With US equity markets stabilizing after Wednesday’s sharp sell off, it’s likely that all the local banking names will get a lift when the ASX re-opens on Monday.

We see scope for a corrective bounce into the $32.50 area, and suggest looking to buy NAB shares outright, or consider buying the $32.00 call options into June.

Aussie Dollar Pops Higher After Jobs Data

The AUD/USD traded higher after yesterday’s domestic employment numbers beat expectations.

With headline jobs growth reported at 37.4k (versus 4.5K consensus) the AUD/USD pushed against the resistance level at .7450.

We don’t expect these data to move the RBA from their easing bias and, if benchmark overnight rates are going to move, the likely direction will be lower, not higher.

Investors who want to profit from a falling AUD/USD can buy the BetaShare ETF with the symbol: YANK.

YANK is an inverse EFT, which means that the unit price trades higher as the AUD/USD moves lower. YANK is also weighted, so that a 1% fall in the currency translates to a 2.5% gain in the unit price.

When the AUD/USD traded down to .7330 last week, the unit price of YANK was $15.54. We estimate that if the AUD/USD trades back to the January low of .7150, the price of YANK will be $16.50, or an approximate 10% gain from current levels.
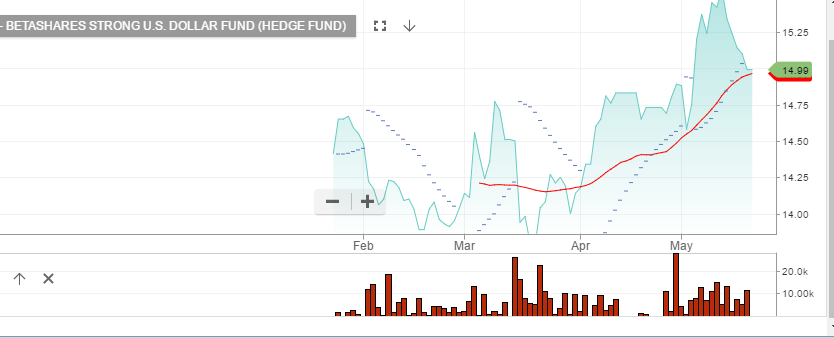
YANK ETF


Chart Watch – Goldman Sachs

Goldman Sachs has sold  off $40 since the high created on the 1st of March. The chart image below shows price action is now finding minor support within a weakening short-term channel.

We’ll continue to watch the chart pattern unfold with anticipated resistance back up at $230.

The relevance of tracking GS for local investors, is it may provide an indication  as to when our local banking & finance stocks will find new selling pressure, should they have a minor bounce from yesterday’s lows.

Chart – Goldman Sachs


ETF Watch – IVV (S&P500)

The IVV is an iShares ASX listed ETF that provides exposure to the S&P500 index of stocks.

Our Algo Engine has triggered multiple buy signals over the past 3 years and so far, no sell signals. However, with the index at 18x earnings and deteriorating global economic data, we feel now is an opportunity to lock-in gains and wait for the next Algo Engine buy signal.

Chart – IVV


US Equities & Bonds

The US 10 YR treasuries  have fallen from 2.62% yield, to now trading at 2.23%. US economic data is deteriorating and the bond market is suggesting that a June rate hike is now less probable.

Lower bond yields make it more difficult for banks to expand their net interest margins.

The following graphs show the recent trends in GE and Goldman Sachs. We’ve been following GE since January as a leading indicator of the headwinds facing global industrial companies.  We’re now seeing this weakness manifest in the beginning of a more broad based equity market sell-off.

Chart – GE
Chart – Goldman Sachs


Orica Slips On Lower Earnings

Orica Limited has reported that their 1H17 net profits after tax was $195 million, which beat the expectations of $185 million.

However, ORI shares are down close to 2% at $18.26 as revenues fell and guidance on key Ammonium-Nitrate prices are pointing lower.

An oversupply of Ammonium-Nitrate will likely act as a drag against future earnings and cap the share price below $19.25.