BHP will release its 2Q FY17 production report tomorrow. We anticipate the strength in iron ore, coal and copper will likely see production tracking in-line with FY17 guidance.
The forecast for FY17 revenue of US$40b and net profit of $6.8b should generate an EPS of $1.25, which will place the stock on a 3.3% forward yield.
We remain long BHP with covered call options at or near $28 into April/May as our preferred strategy.
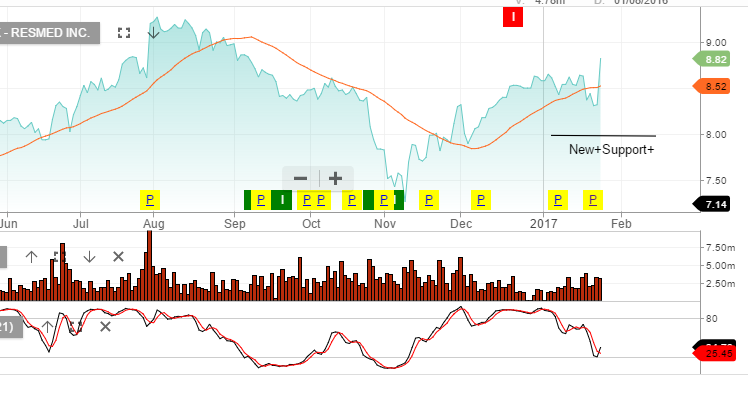
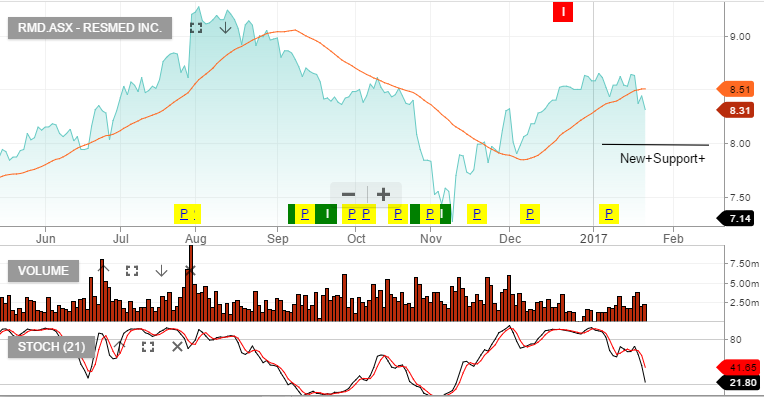
ResMed beat expectations by reporting Q4 earnings of 73 cents per share on quarterly of revenue of $530.40 million. During the same period last year, the firm earned 69 cents per share. This represents a 16.7% increase in revenue from the same period last year.
The street had estimated earnings of 70 cents a share on quarterly revenue of $518.60 million.
These earnings and revenue figures represent a return on equity of 23.10% and a net margin of 17.87%
We started buying ResMed last week, ahead of the earnings release. We’re now up 6% from our entry level and will look at add covered call options to further enhance the return.
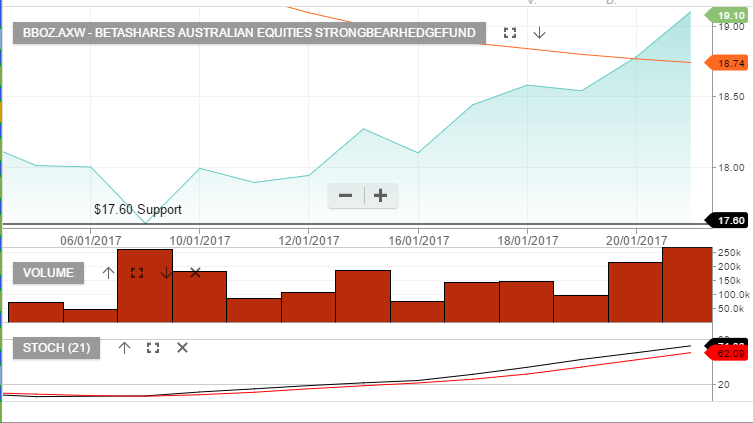
As an update to our ETF Watch segment on the blog, the below chart of the BBOZ ETF, (XJO x2 inverse), reflects the inverse correlation between the XJO and this product. Whilst the XJO has traded lower, the BBOZ ETF has rallied almost 10% since the 9th of January.
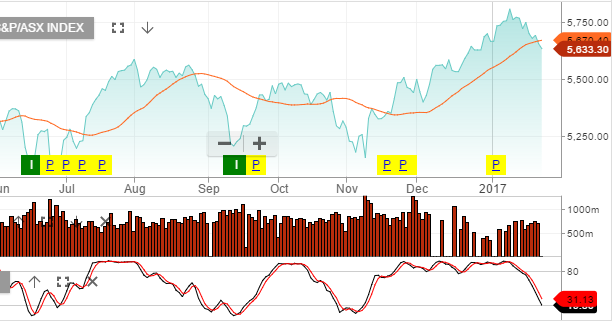
After an 8 year bull market we’re becoming increasingly concerned about equity valuations over the next 3 to 12 month. There are concerning signs in markets and these are starting to show up in the charts.
Many large-cap US stocks are showing a “rolling-over” style technical pattern. Following GE’s earnings result last week, along with recent Chinese export data, we’re getting a sense that risks are building.
We’ve used the recent rally in banks as an opportunity to take profits and re balance portfolio’s towards defensive names. We’re also adding short exposure through index ETF’s over the XJO and S&P500.
BXB released a 1H17 trading update which included an FY17 profit warning.
BXB announced that it expects 1H17 constant currency sales and underlying profit growth of only 3%, down from previous forecast of 7 – 10%.
North America Pallets were impacted by both revenue and cost pressures.
We’ve been concerned about BXB’s high PE valuation and low compressed yield. To protect against the risks, we hedged BXB by approximately 5%, whilst keeping exposure to the upcoming dividend.
At $10.00 we think BXB is a new counter trend buying opportunity and any short exposure or hedging should be closed and new long positions established.
We’ll keep you informed via the blog when this change in directional strategy occurs.
The Standard and Poor’s 500 index is a widely followed indicator of the general direction of the US stock market, and by extension, global equity markets.
The reason for the wide following is clear. The S&P 500 comprises 505 common stocks and covers 80% of the American equity market on a capitalization basis.
However, so far this year, the S&P 500 index has had wide intra-day ranges but has gone practically nowhere. It finished the fist week of the year near 2277 and at 2275 in the second. It finished last week near 2274.
The technical indicators are not generating clear signals with the 30-day moving average being tested over the last 4 sessions but not broken.
The prospects of business-friendly policies from the Trump administration may be helping to support the market , while fear that much of the good news has already been discounted in the market has tempered enthusiasm for new buyers.
It’s our view that this indecision pattern will be resolved as the US earnings season moves into its second full week. At this point, the risk remains asymmetrically to the downside on weaker earnings reports, versus the upside potential on better-than-expected reports.
This has been a busy week for foreign exchange traders with the USD trading on both sides of the ledger and in wide ranges. With the inauguration of Donald Trump later today, investors appear to be taking defensive positions against the US Dollar. Earlier in the week, Mr Trump was quoted as saying that he thought the USD was too strong and was at a level which hampered US exporters.
Not surprisingly, the USD Index dropped over 150 points on that news flash and is now sitting on support just below 101.00.
Since then, senior Trump advisors have been downplaying those comments by saying they were meant to be directed specifically toward the Chinese Yuan, and not as a general view of the Greenback.
With respect to comments from Donald Trump, the investment community will have to grapple with how to take these seemingly spirited and personal views. Clearly, some of his more strident positions taken during the campaign have been softened, but the market will be subjected to these unannounced twitter and press comments throughout his Presidency.
In the larger picture, of the numerous and complex factors that impact foreign exchange rates, the wishes and desires of elected officials don’t often seem to be particularly important. Our longer-term bullish view for the US Dollar is based on the divergence of monetary policy , the relative health of the US financial system, the domestic interest rate trajectory and the uncertainty of the European election results.
On balance, and in simple terms, we would like to be positioned into the US inauguration with a “Risk-Off” posture. This means looking at long USD positions against the all other G-7 currencies except the JPY, a long bias toward the US Treasuries (lower yields) and short US equities.
The AUD/USD traded about 1% higher on the week as Chinese Inflation and Retail Sales data gave the Aussie a lift. The pair is now pushing against a key resistance level near .7620, which will likely find selling pressure.
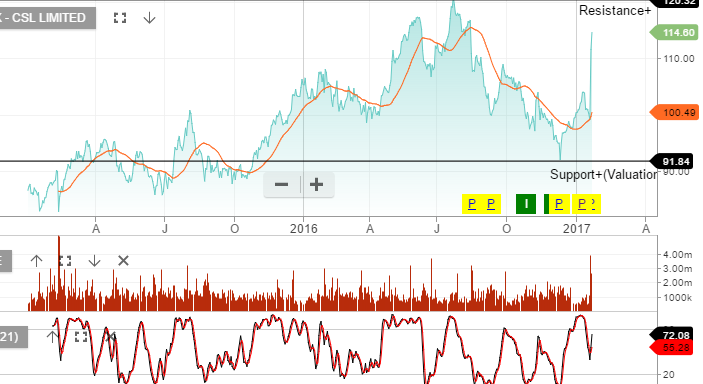
The share price of CSL jumped almost 14% to $115.90 this week after surprising the market with a big earnings upgrade.
After posting a first-half profit of about USD 800 million, CSL expects net profits for the year ending June 30th to grow between 18 to 20% on a constant currency basis. This forecast included a USD 20 million headwind from unfavorable currency conversions in the AUD/USD.
However, as positive as the headline and resultant share price rally appear, we suggest that this earnings news needs to be considered within a broader context.
18 months ago the F17 NPAT expectation was $ USD 1.7 billion, 6 months ago it was USD 1.5 billion and the first estimate 2 months ago was USD 1.28 billion.
In essence, this week’s news that the profit outlook has been raised to USD 1.33 billion is considerably lower than the earnings figures that CSL was expecting just 6 months ago…….yet the share price has moved from $90.00 to $114.00.
Based on industry assessments about potential pockets of competition within the immunoglobulins area, the forward earnings trajectory could be revised again over the next few months.
As such, we consider CSL in the $114.00 to 120.00 price range to be full-valued.
Our Algo Engine triggered a buy signal at or near the recent lows of $92.
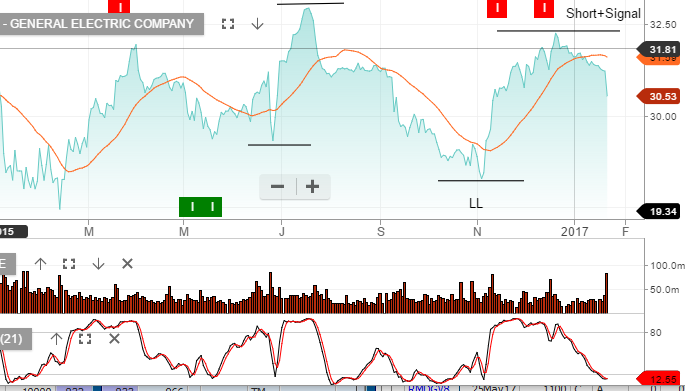
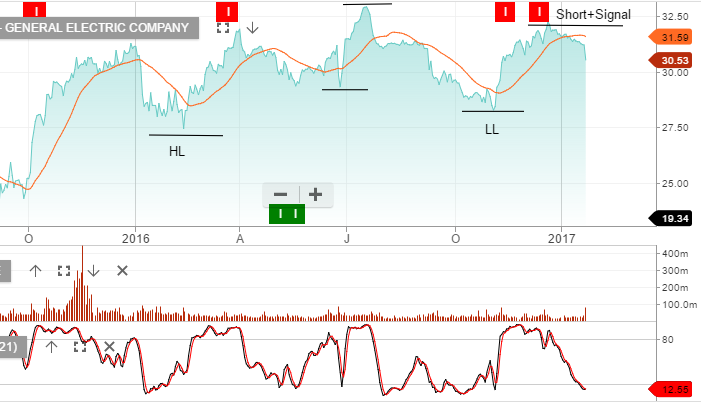
Shares in General Electric fell to a 1-month low of $30.30 after the company reported Q4 revenue which fell short of expectations.
The company’s Q4 earnings of 46 cents per share were in line with forecasts, but the revenue number of $33.08 billion was lower than the consensus estimate of $33.63 billion.
For calendar year 2016, GE delivered $1.49 of earnings per share, 1% organic growth and returned $30.5 billion to share holders through dividends and share buybacks.
We expect GE’s oil and gas operations merger with Baker Hughes will pay dividends throughout 2017 and would look for buyers to return near the November 4th support level at $27.50
It’s somewhat concerning the rollover in GE and likewise in top market cap US financials. We watch these signals closely as further evidence of structural share price weakness.
Our Algo Engine flagged the short signal setup in GE at or near the recent high of $32.
Here is a list of the first group of companies reporting where we’ll be reviewing the earnings results and keeping you informed….
Resmed 24th Jan – Expecting better numbers following distributor de-stocking in the September quarter. New mask release should boost sales.
Tabcorp 2 Feb – Too early for any benefit from the Tatts acquisition, however, we’re looking for commentary on forecasts and cost savings.
James Hardie 2 Feb – US building cycle remains strong but we’re now cautious on James Hardie based on valuation concerns. Need to see EPS growth of 15%+
Transurban 7 Feb – We’re expecting strong free cash flow and minor dividend upgrades.
CIMIC 8 Feb – Expecting solid growth numbers and commentary on the integration outlook of UGL following the recent take-over
RIO 8 Feb – Good production numbers and we expect earnings to meet consensus forecast.
AGL 9 Feb – We’re concerned the market is too optimistic here and we will be looking at this result closely.
AMP 9 Feb – After the downgrades from the under-performing life insurance, we question what the future earnings look like. AMP as an asset manager is a very attractive business, we just need to re-establish the expected EPS growth rate.
Amcor 13 Feb – Looking for confirmation of 8% EPS growth
Ansell 13 Feb – FX impact could be a minor negative but the underlying business is improving. We’re looking for detail and timing on the pending corporate restructure strategy.
Chart – RMD
Sophisticated Investor?
We have special opportunities available for Sophisticated Investors. If you're interested, and qualify, please provide your details below.