Dow Jones – Where is Fair Value?

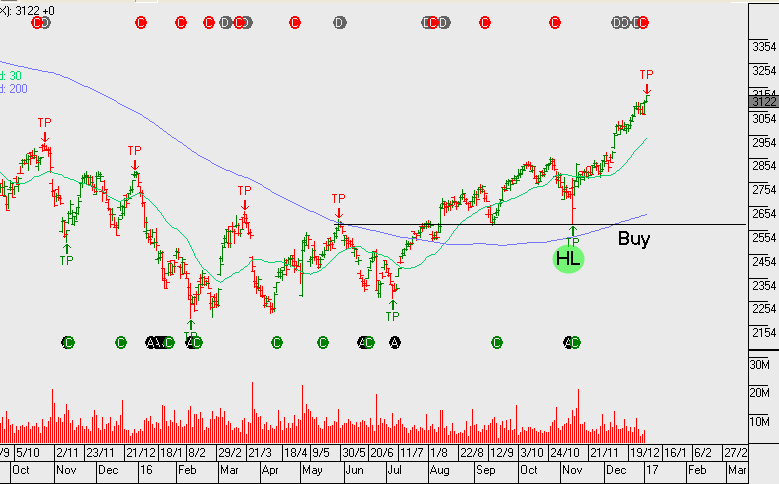
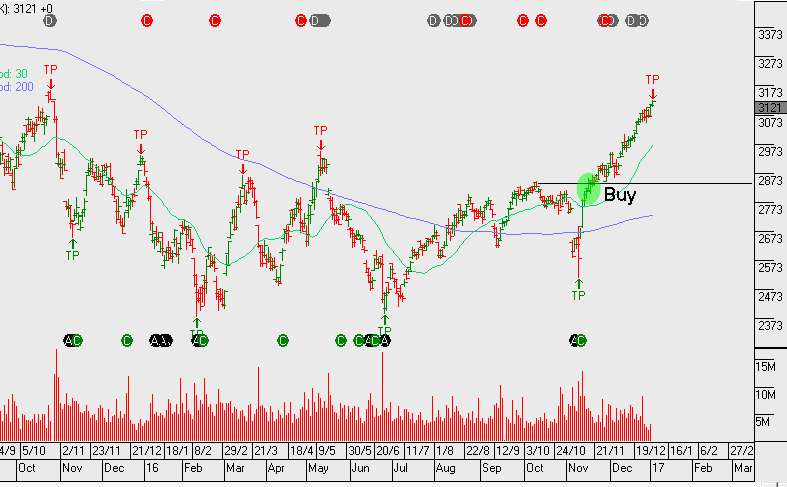
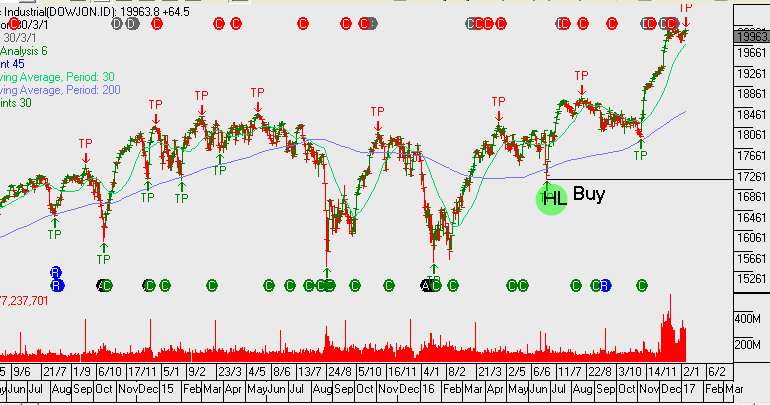
Both the Dow Jones 30 and SP 500 finished the first week of 2017 in positive territory gaining 1% and 1.5%, respectively.

Many market commentators are suggesting the potential for overbought conditions as the major US stock indexes have added about $2 trillion in share value over the last 8 weeks.

There’s no question that the Bulls are currently in charge. However, with earnings season just a few weeks away, investors need to be cognizant of the index earnings required to maintain these lofty price valuations.

Earnings over the last three years have been in a tight range between $116.50 and $118.00. Based on our calculations, if US companies don’t post EPS growth of 10% and only deliver a flat $120.00 of average annualised EPS, the Dow Jones 30 is worth 16,500 points with 10-year bond yields at 2%.

Although energy and commodity companies should help to lift the average from the prior 12 months, bank earnings should also be up in the fourth quarter. With this in mind, the middle ground may result in 5% average EPS growth ($125 per share), which then supports the Dow Jones Index trading at or near 18,000 points.
Dow Jones


Update on the Yield Trade

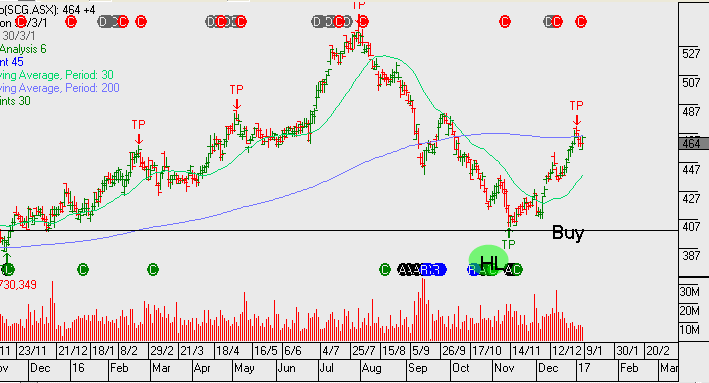
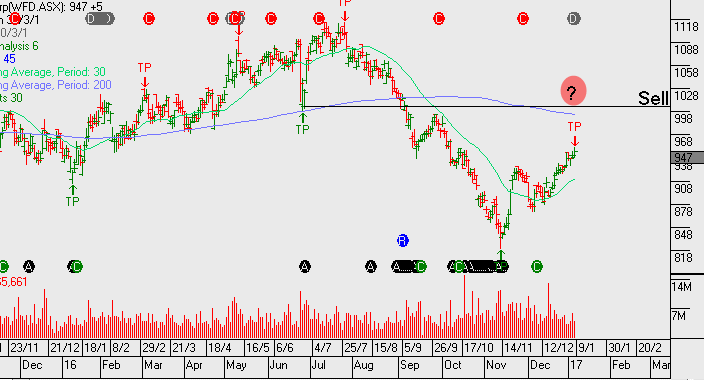
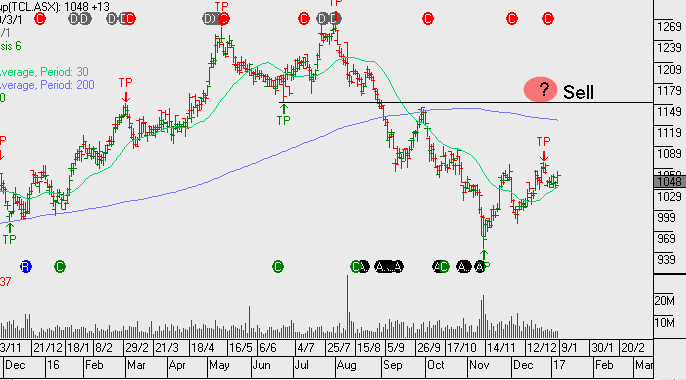
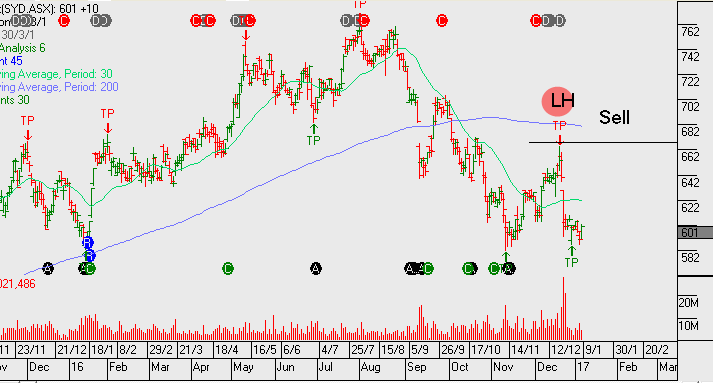
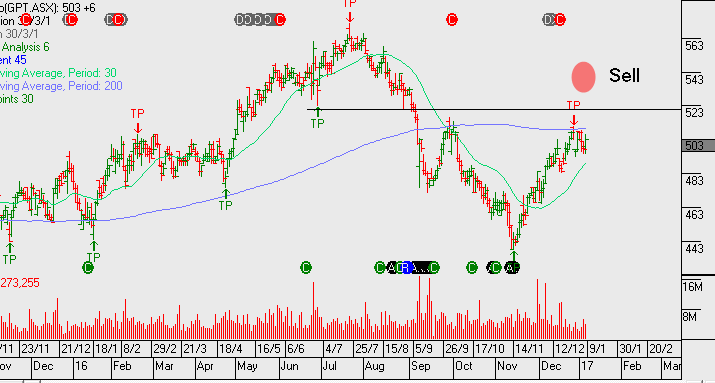
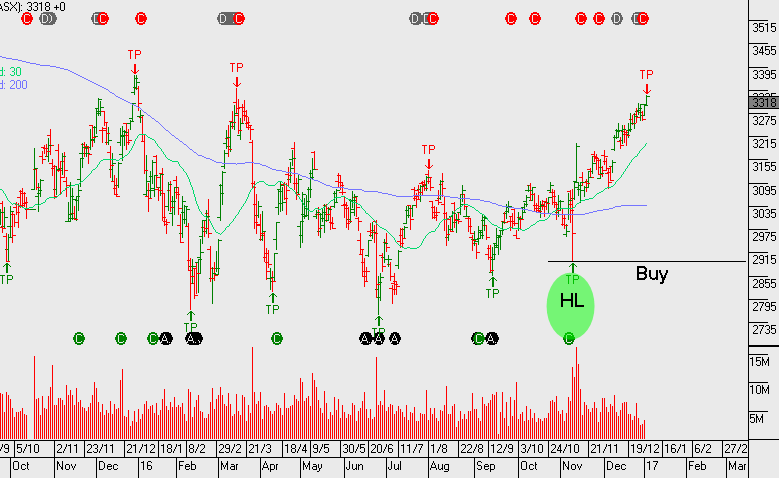
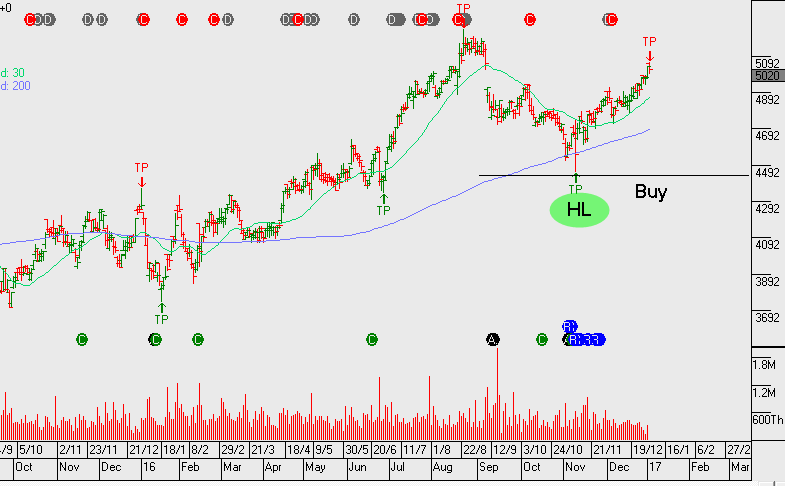
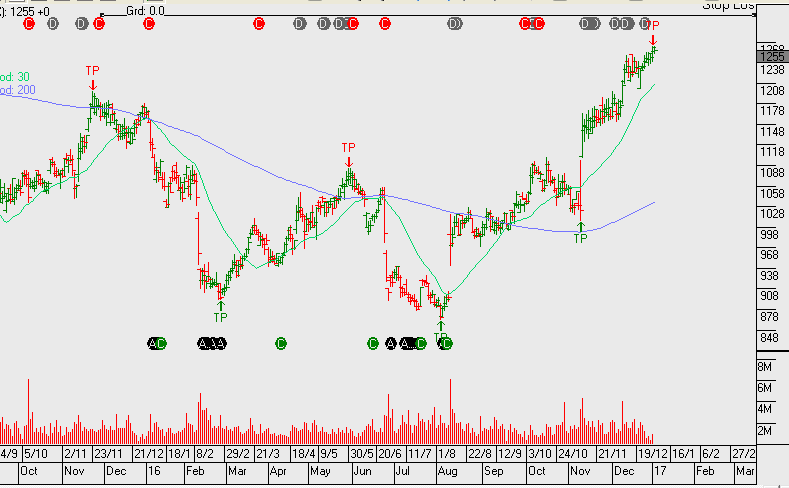
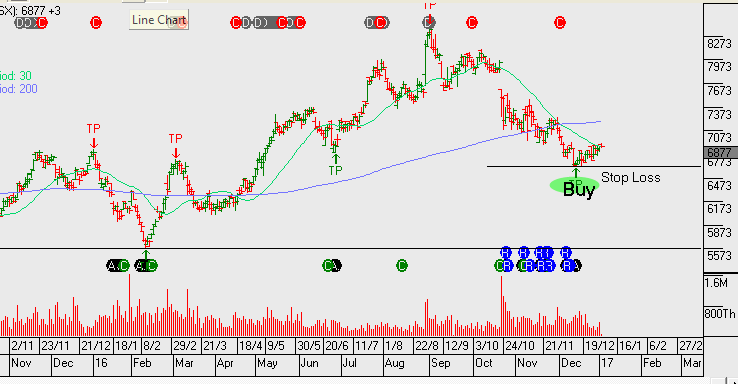
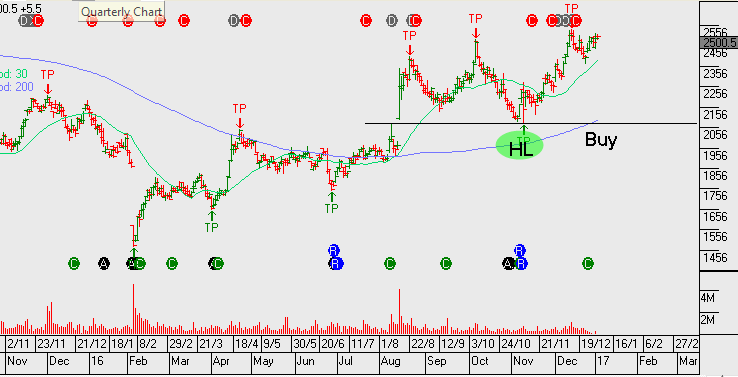
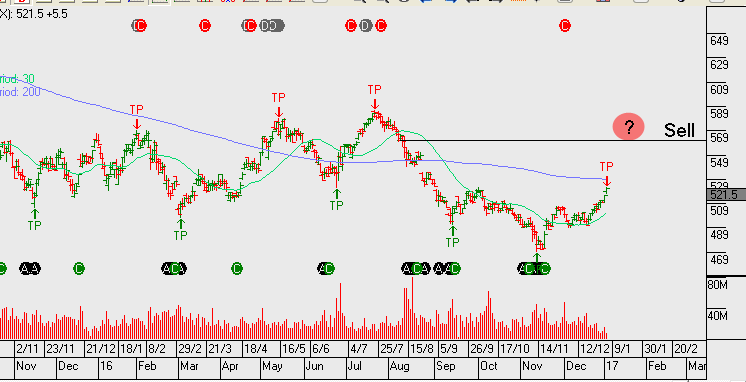
In late 2016 we began highlighting yield names which were oversold and were likely to bounce back coming into the year end. Our preferred names in the yield basket were WFD, SCG, GPT, SYD and TCL. On average, these names have rallied over 10% from their November low.

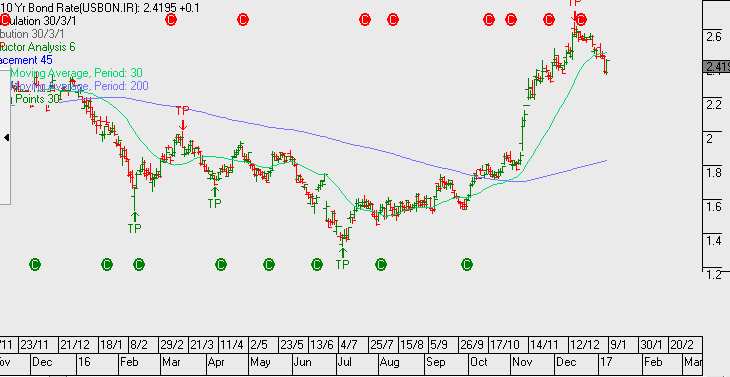
The consolidation of US yields, (bond prices no longer falling & yields no longer moving higher), along with the oversold condition in our domestic yield sensitive companies, were enough to generate the rally.

From here we feel  these names will remain supported, especially if volatility picks up in the broader market during the Jan – March period. With this in mind, we continue to hold our yield basket and overlay covered calls to boost the cash flow to 10%+ on an annualised basis.

Chart – SCG
Chart – WFD
Chart – TCL
Chart – TCL
Chart – GPT
Chart – US10YR


Tabcorp – Low Risk Income Play

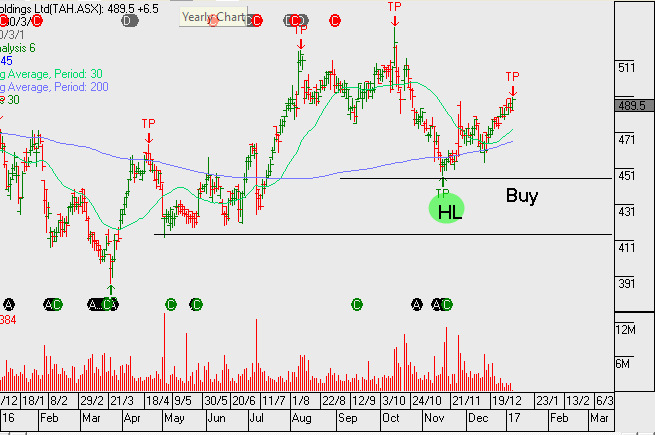
Following TABCORP’s successful bid for Tatts Group, the next 12 months should provide a low risk opportunity to generate 10 t0 12% annualised cash flow from TAH.

The Algo Engine generated a buy signal early in November at $4.50. We remain positive on the stock and continue to acquire shares and sell the May call options with a view towards collecting the February dividend as well.

Chart – TABCORP


Aussie Dollar Pointing Higher

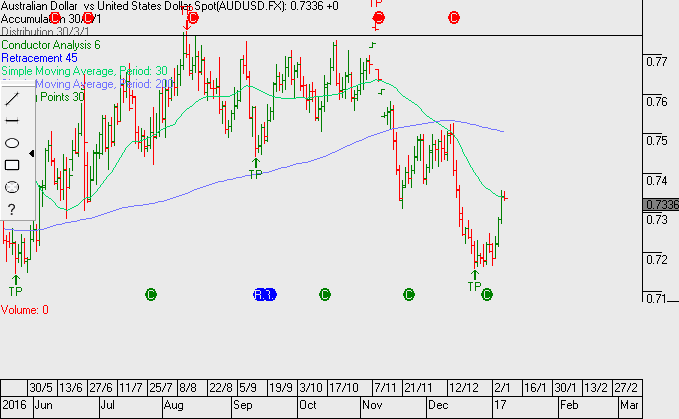
After holding above long-term support at .7150 going into the end of the year, the Australian Dollar has started 2017 on a firmer note. Higher prices for Copper, Crude Oil and Gold combined with the sharp rise in Australian Service Sector activity have added to the positive fundamental tone.

The technical picture has also improved as general US Dollar weakness has lifted the Aussie above its 30-day moving average near .7340 for the first time since early November. This morning’s better-than-expected Trade Balance report should keep the currency well bid throughout the Asian session and into the weekend.

With the US Non-Farm payroll data expected to print a little softer tonight, we see scope for the recent move in the AUD/USD to extend back to the December 15th high of .7430. We would consider that price a good level to exit long positions.
Chart – AUD

Telstra – Counter Trend Rally

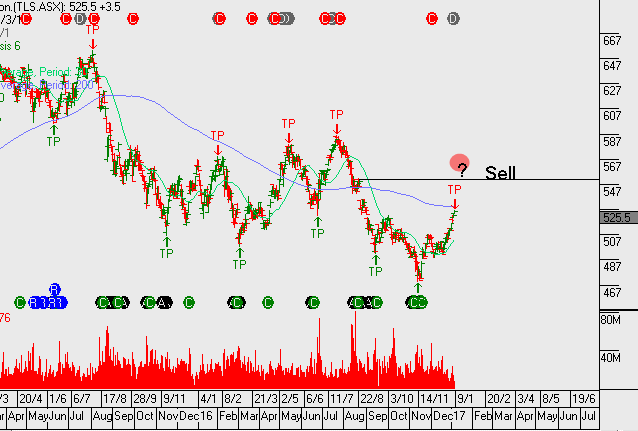
We’ve been buyers of Telstra from the recent lows and see the possibility of the stock trading into the $5.40 to $5.70 range in the weeks ahead. We are undecided if we sell covered calls over TLS and will likely wait until the February earnings result, to see what the underlying EPS growth trends look like.

We have TLS on a 6% yield and delivering around 4 – 6% EPS growth into 2017.

Chart – TLS

Resmed – Stay Alert

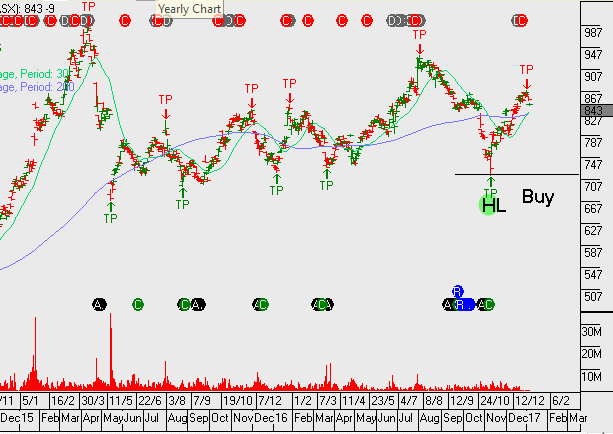
Resmed has rallied from $7.50 in November to $8.70 and appears to be pulling back from the recent high. It’s likely the Algo engine will trigger a buy signal in the coming weeks if the current retracement sees prices remain in the range of $8.00 to $8.40.

We think the fourth quarter earnings in RMD will reassure investors and support buying ahead of the result on a dip in price should create a solid entry level into 2017.

Chart – Resmed


Gold: A Corrective Move Higher

In our 2017 preview, we noted that Gold was ending the year in a  stabilization pattern after falling sharply from the November highs. This fall saw the yellow metal drop from $1330 to $1120 (16%) in just over a month.

So far this week, Gold has moved from around $1140 to the current level of $1180. We feel this move is a combination of short-covering and a generally weak tone in the US Dollar. Technically, Gold has posted its first close above the 30-day moving average since November 9th, which suggests that this corrective move has more upside potential in the near-term.

Our base case is that the US Dollar will continue to consolidate from its sharp rally over the last two months, which will lift Gold prices higher. The daily charts point to the November high of $1220.00 as the next significant upside target within this corrective phase, and a good place to exit long positions.

ASX Banks and Financials

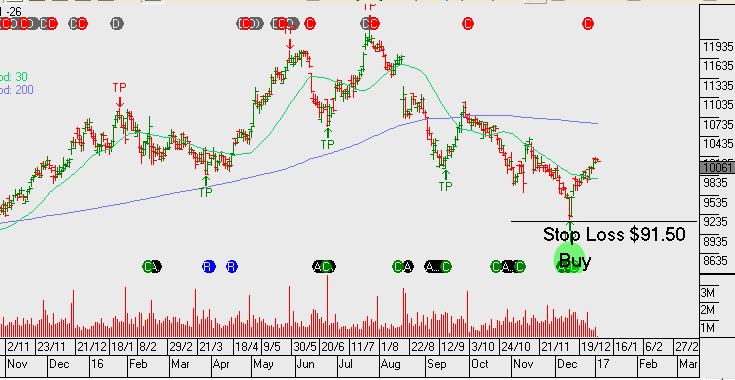
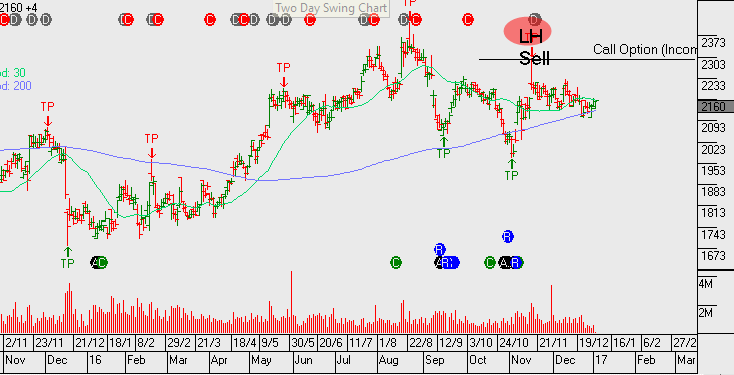
Currently, ASX leading Financials are being dragged higher as the US equity rally continues into the lead up to their fourth quarter earnings results. We’re somewhat sceptical of the valuation support and yesterday started hedging our banking exposure in client portfolios. This was done through using in-the-money European-style calls over CBA and slightly in the money February calls over NAB, as two examples.

In the case of CBA, we stay exposed to the February dividend and franking credit but have hedged a price pullback of up to 5% between now and March.

In NAB, we’ve hedged to a similar extend but without the need to protect the dividend. NAB’s next payment period is not until May

Chart – ANZ
Chart – NAB
Chart – WBC
Chart – ASX
Chart – CPU


US Bank Share Price Trends

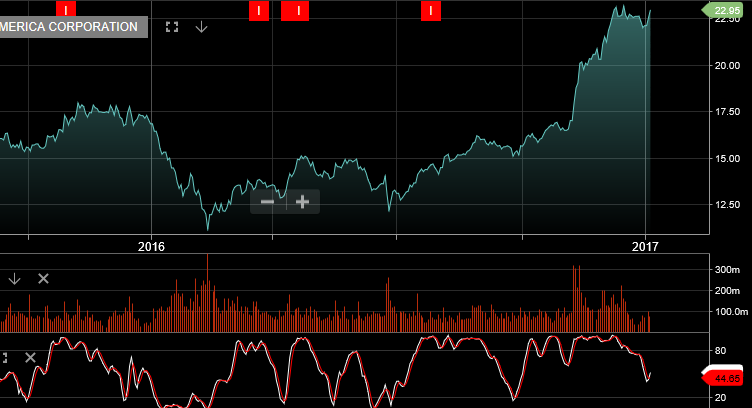
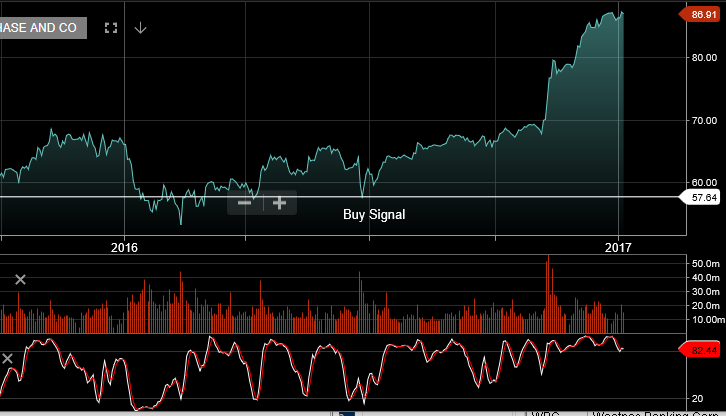
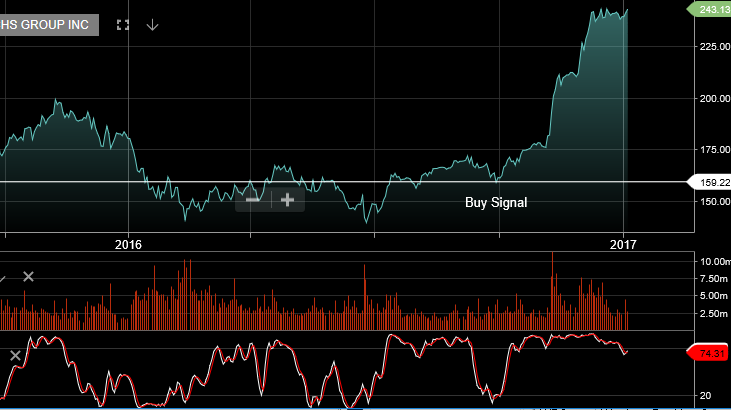
On 13th of January, the first of the major US financial institutions begin announcing their fourth quarter earnings results.  Bank of America, JP Morgan and Wells Fargo will be the key results to watch.

The rise in US financials has been significant by any measure; multiples have expanded ahead of what investors are hoping to be record levels of profit and bullish forward guidance. The US financial sector has been boosted by the expectation of higher interest rates, deregulation and high trading earnings to drive profits.

However, we have concerns: economic growth in the US is not that strong, the year-over-year GDP growth rate was only 1.7 percent in the third quarter, S&P500 average year on year EPS growth was only +4% in the third quarter and it’s had to see growth improve dramatically in 2017, especially with a stronger US dollar.

Chart – Bank of America
Chart – JP Morgan
Chart – Goldman Sachs


Asset Allocation Strategy

Based on our view that risk assets are over extended and S&P500 earnings will most likely not support the current PE multiple, we are tilting client portfolios towards a more defensive asset mix and using  derivatives to generate lower risk returns.

Over the next 3 months, portfolios with allocations towards banks, resources, industrial and property run the risk of seeing significant volatility for little or no added upside benefit. In times like these, investors need to look at their strategy for managing risk and calculate the potential upside of staying fully exposed versus reducing exposure, moving to a defensive asset mix and generating returns through at-the-money calls.

We like CSL, SHL, RHC, ANN, TLS, TCL, WFD, CCL and CTX as examples of defensive names that can deliver both capital growth, as well as 10% of annualised income through the upcoming dividend and call option premium.

Chart – CSL
Chart – SHL
Chart – RHC
Chart – ANN
Chart – TLS


.