US Bank Earnings Preview

The fourth quarter earnings season kicks into high gear this week when the first of the major US banks report tomorrow night. Expectations are mixed, based on forecasts that include the impact of the FED raising interest rates and the Presidential election.

Bank of America and JP Morgan are both expected to report solid bottom-line growth. On the other hand, Wells Fargo is expected to say that its earnings have slipped from a year ago.

Below is a quick overview of what is expected from these three banks.

BoA Q4 profit is expected to come in at 38 cents per share, which would be close to a 30% gain from the year-ago period. The consensus has earnings pegged at 40 cents per share.

JP Morgan is expected to announce it had earnings of $1.47 per share, which would be up from $1.32 per share a year-ago on revenue of $23.70 billion.

Wells Fargo is expected to post Q4 EPS of $1.00 per share which is down three cents from a year ago on revenue of just over $22.00 billion.
Australian Bank Profit Announcements – Key Dates

Bank profit announcements start in February with the following key dates worth noting.

SUN 9 February, BEN 13 February, CBA 15 February along with 1Q17 trading updates from ANZ and NAB in February.

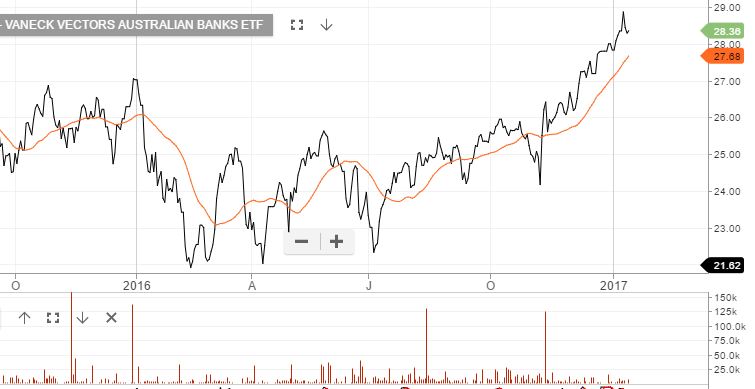
Following the recent rally in bank shares, we see the current trading range as full value, therefore, placing the banks at risk of being buffeted by any increase in market volatility.  Although net interest margins have improved, the prospects of earnings growth is modest with the outlook between 1% – 4% growth at both top and bottom-line.

We also remain concerned that the cycle for bad debts is likely to rise from the current historic low levels.

Charts – Aust Bank ETF


Oil and Metals

Copper prices jumped today as Chinese inflation data picked up last month, sending a reassuring signal about demand from the world’s largest consumer of industrial metals. China’s Producer Price Index rose 5.5% last month, which was better than the market expectation of 3.3%

The forward month red metal was up 2.9% at $2.60 per pound, posting its largest one-day gain in two months on the COMEX exchange in New York. A reduction in copper stocks at the LME will add short-term support to the upside for prices.

We expect to see firm resistance in the $2.74 area, which represents a “double top” chart pattern dating back to November.

A surprise jump in US inventory data extended the recent down move in crude oil prices. We now see solid support around the $50.00 level.

We still like the long side of oil names but feel investors should be adding covered call options to WPL and OSH to enhance the yield.

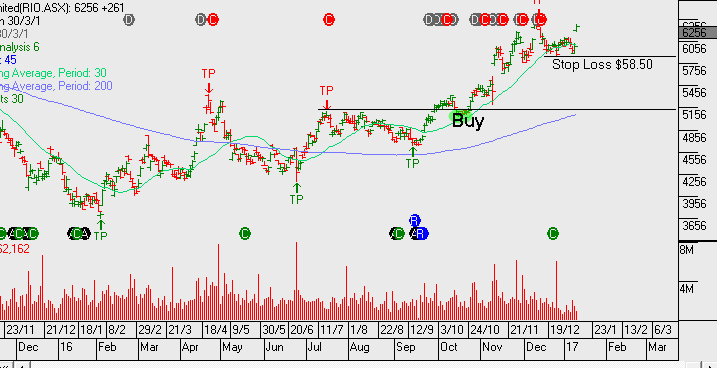
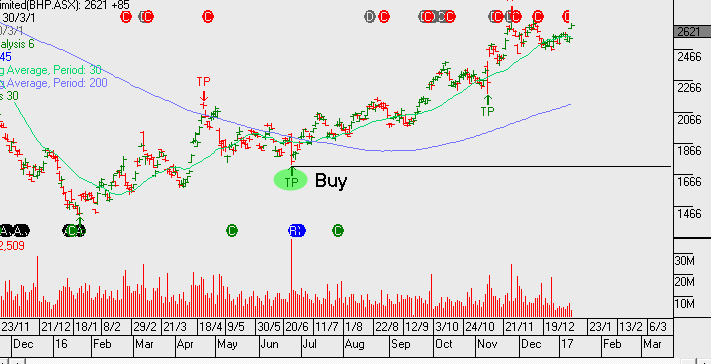
We’ve allowed upside to $27 in BHP and upside in RIO to $63 before capping out our short term gains.

Chart – BHP
Chart – RIO


Woolworths – Valuation Review

Woolworths has recently sold their petrol business to BP for $1.8b which helps to underpin the groups balance sheet. As a result, we’re likely to see Woolworths accelerate their store refurbishment program.

In late February we’ll see the earnings update from Woolworths and based on consensus numbers we expect $58b in revenue, EBIT of $2.5b with reported profit around $1.5b.

On a forward basis the underlying earnings growth should track around 4% with FY18 EPS of $1.30 and DPS $0.88, this will place the stock on 3.7% yield.

Any rally in the share price following the Feb result, we feel adding a covered call at or near $25 – 26.50 offers a suitable risk reward payoff.

Chart – WOW


ASX – Earnings Review

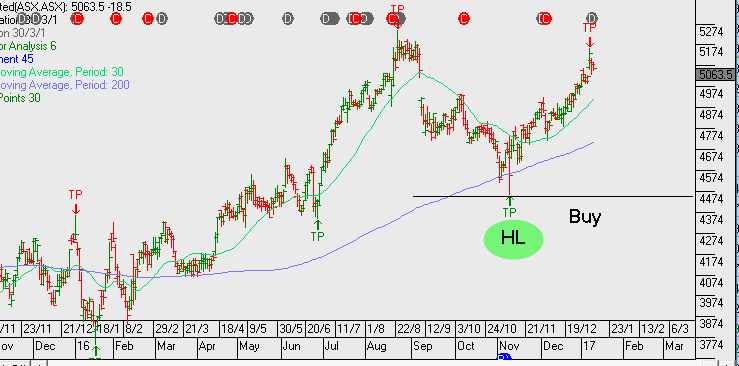
Shares in ASX have performed well since the Algo buy signal in early November.  If we look out 12 months, ASX should deliver revenue in FY18 of $850m and EBIT of $600m. The business is growing at around 5% p/a and management are remaining disciplined on cost control.

From an earnings per shares basis,  FY18 EPS will increase from $2.30 in FY17 to $2.45 in FY18, and DPS will increase from $2.10 in FY17 to $2.20 in FY18. This places ASX on a forward yield of 4.3%.

We think ASX shares are trading at the top end of the valuation range given the compressed yield and moderate EPS growth. The upside still remains the potential of a take-over bid as global exchanges look to consolidate.

Chart – ASX


US Wages and Inflation

The US Federal Reserve officially ended their stimulative policy of Quantitative Easing (QE) on October 29, 2014.

Since then, investors have been following the monthly Non-Farm Payroll (NFP) report for insight about how the condition of the US Labor market would influence US interest policy, the US Stock market and the US Dollar.

Within the NFP report, the three main components are the headline new job creation, the un-employment rate and weekly hourly earnings.

For most investors, the headline new jobs data has been the key metric for gauging whether the FED was likely to lift rates or leave policy on hold.

However, as the US is reaching a full-employment zone and the unemployment rate is nearing its lower bound below 5%, we are seeing a change in the policy implication dynamic towards wage growth and its impact on inflation.

Since the FED first lifted the FED Funds target rate in December 2015, the 10-year note yield has risen from 1.30% to 2.50%.

The FED understands that US wage growth is feeding directly into core inflation aggregates and will likely  shift their policy-making focus away from new job creation to wage growth during 2017.

In last Friday’s NFP report, wages rose .4% for a new cyclical high on a year-on-year basis to 2.9%. This is the fastest pace since 2009. We see the importance of the wage component increasing through the year as the knock-on effect into core inflation is seen in subsequent data sets.

In other words, as we move further into 2017, it’s reasonable to expect investors may be taking positions in the US stocks, bonds and the US Dollar based more on the growth of weekly wages than the number of new jobs created.

On balance, we consider the recent rise in wages as a transitory event which may trigger short term headwinds to the recent stock market rally. Over the longer-term, we still consider the Bull market in stocks to continue with a gradual rise in 10-year yields.


Crude Oil Dumps on Iraqi Export Data

The price of West Texas Intermediate (WTI) crude oil dropped over $2.00, or 3.8%, to $51.90 in New York trade as Iraqi exports posted a record high for the month of December.

This is the biggest daily drop in over five weeks as investors are now concerned about Iraqi compliance with the OPEC production cuts agreed to on November 30th in Vienna.

Crude Oil posted its biggest gain since 2009 last year, largely based on the agreement from OPEC and 11 other countries to curb output starting January 1st.

Non-compliance has been a recurring theme in previous OPEC agreements, and the Iraqi export data may be the first sign of a crack in the most recent production accord.

The close below $52.00 in the front month WTI contract is the first trade below the 30-day moving average in over a month and suggests further downside extension below $51.50.

On the ASX, Oil Search (OSH) reached a 2 month high of $7.45 yesterday but will likely trade lower today. Technically, we look for initial support at $7.00 with the Pre-OPEC key support level at $6.40.

Export Surge – First Trade Surplus in 3 Years

Last Friday, Australia posted its first trade surplus in nearly three years.

The surplus of international goods and services was $1.2 billion for the month of November, which was much better than the market forecast of a $500 million deficit.

The Australian Bureau of Statistics said exports surged 8% in November, while imports were flat. The main drivers for the gain in exports were iron ore and coal, which rose 11% and 25%, respectively.

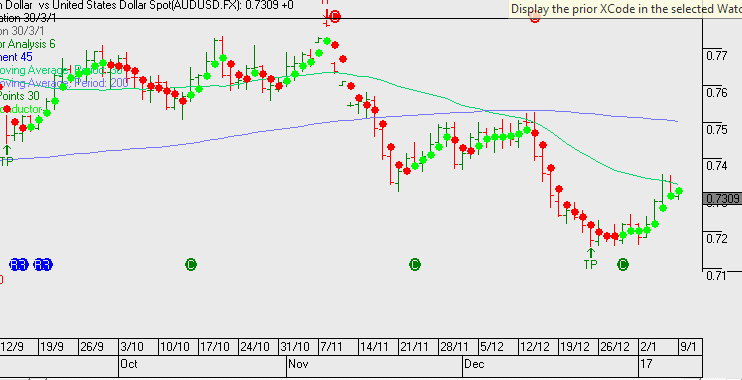
This is positive for the fundamental picture in the Aussie Dollar. We see solid support in the .7290 area with the scope for a move up to the .7430 level in the near-term 

Chart – AUD

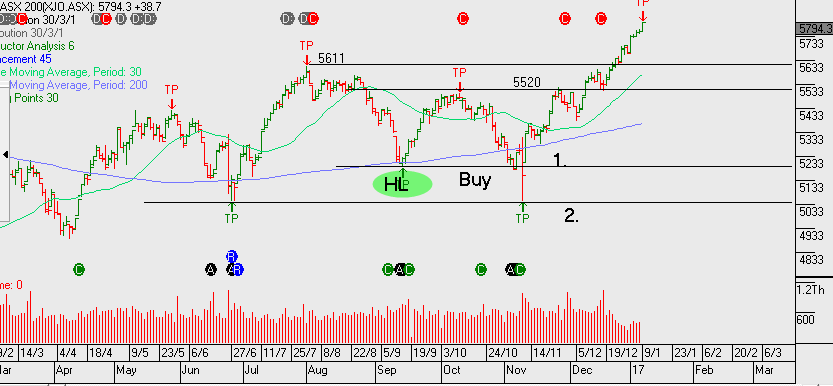
Chart – XJO

Healthcare Algo Buy Signals

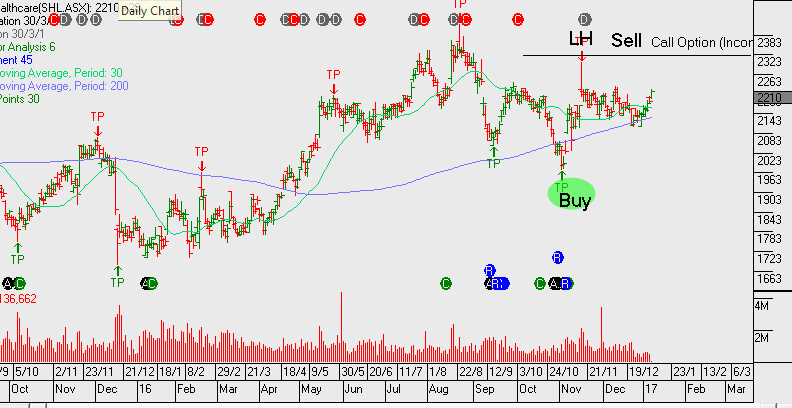
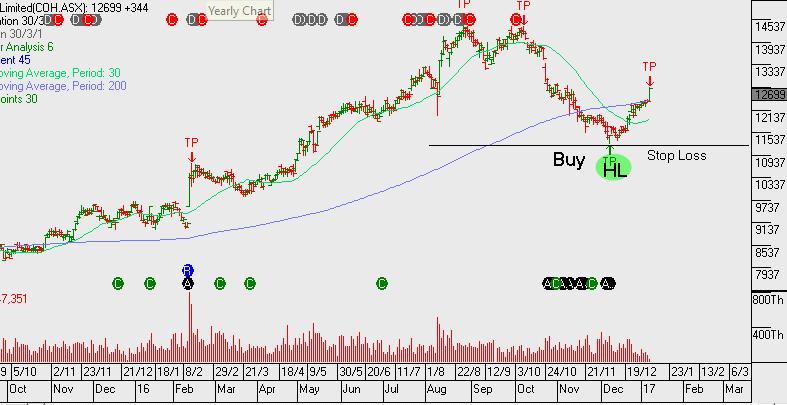
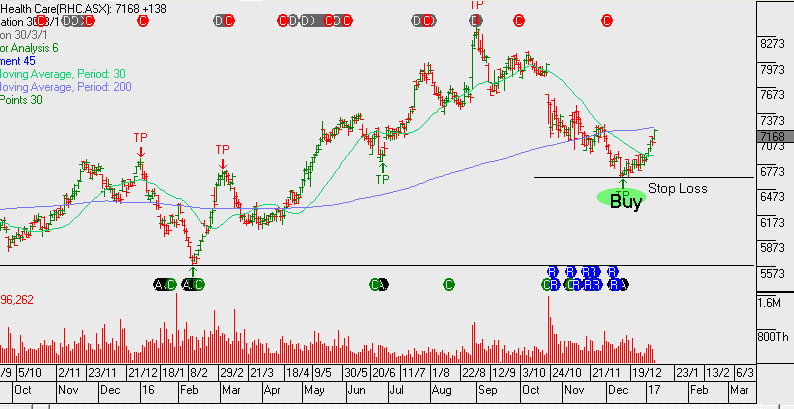
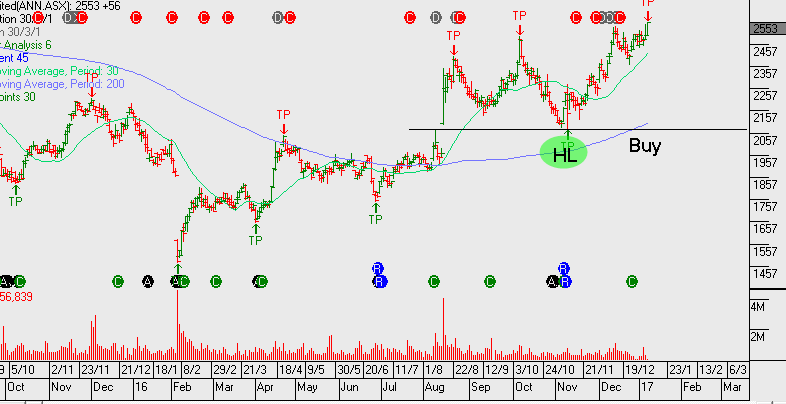
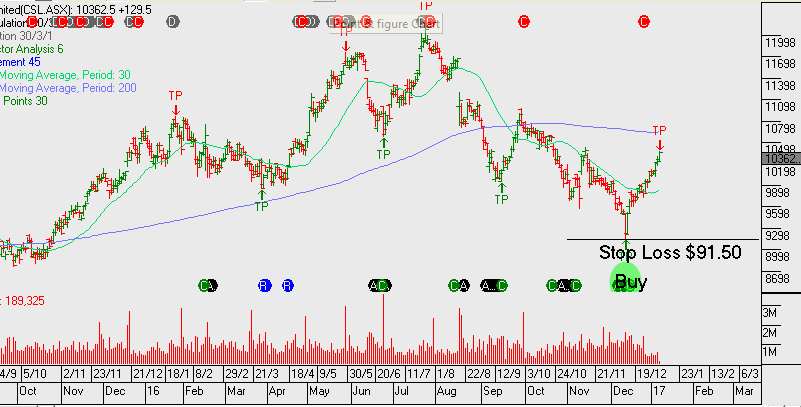
At this point in the market we prefer healthcare names as a sector allocation for new money. Here are the recent buy signals generated by our Algo Engine.

With SHL, CSL and ANN we’ve added covered calls to boost the annualised cash flow to over 10%, whilst still allowing for capital growth if exercised at the strike price of the sold call.


Chart – SHL
Chart – COH
Chart – RHC
Chart – ANN
Chart – CSL

Dow Jones Index – This Warrants A Closer Look

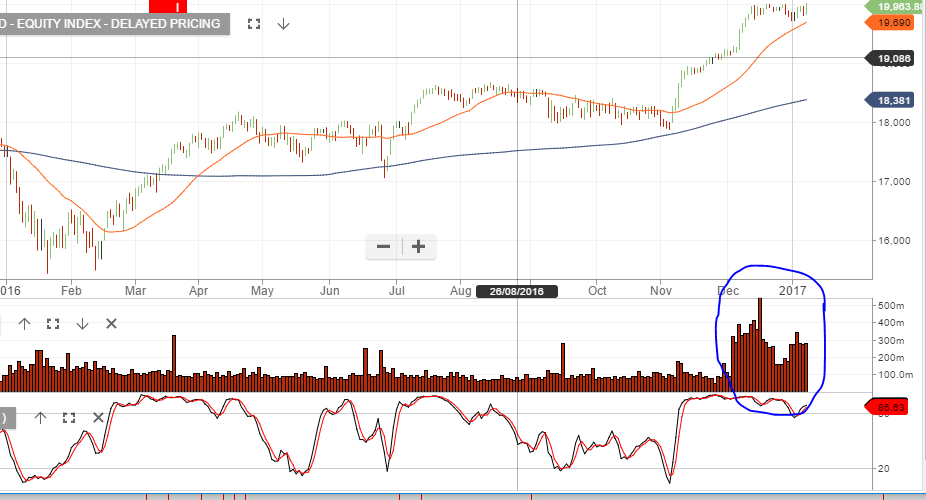
We’re interested in the large pickup in traded volume over the past few weeks in the Dow Jones Index. By any measure the volume is abnormal, even compared to prior end of year volume traded.

The conclusion we draw from this is: whilst ETF’s are helping to accelerate index volumes, it seems a reasonable conclusion that it could be part of a series of indicators which are helping to suggest that we’re near an exhaustion point in the US equity rally. We’ve seen market tops coincide with big volume distribution patterns like this before.

Chart – Dow Jones