How Long Will The XJO Range Trade?
Over the last 12 weeks, the XJO index has traded in a range bound, pennant formation.
In technical terms, this is known as an “indecision” pattern and is usually resolved by a measured move through the top of the range, or broken through the bottom of the range.
The current price set-up has been bound by the June 8th low of 5606 and capped by the June 15th high of 5850.
After one of these levels are breached, the measured move would be expected to reach the May 2nd high of 5950, or drop down through the low price of 5606 posted on February 6th.
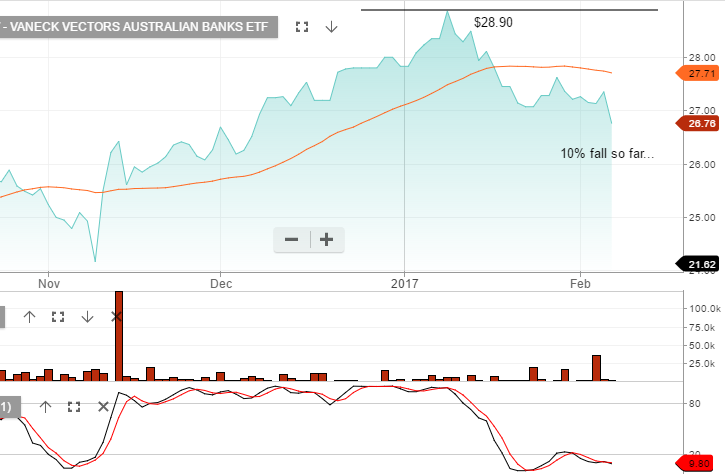
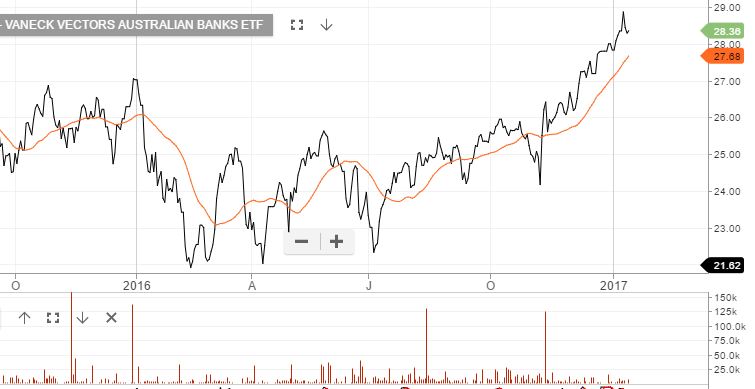
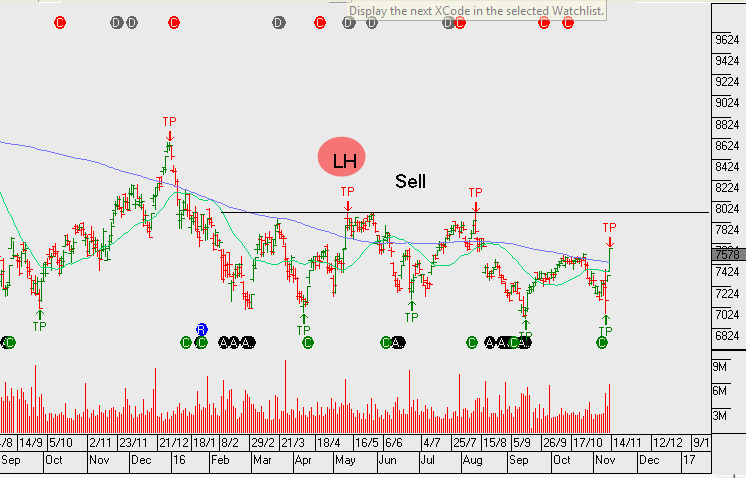
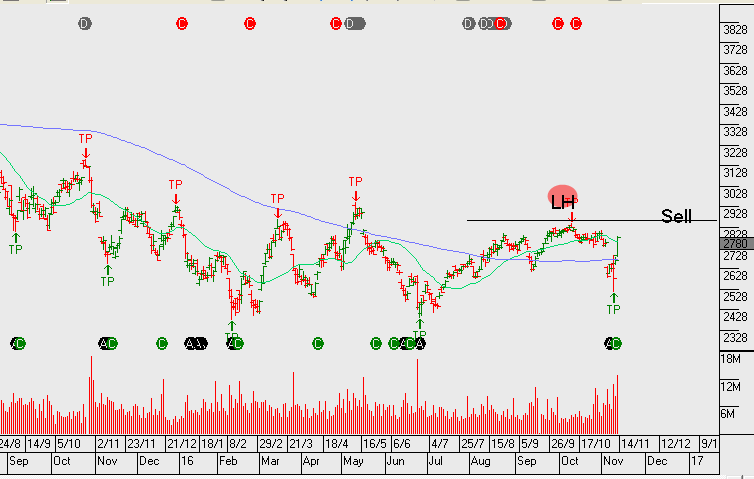
The banking sector is the heaviest weighted group of stocks in the XJO. As such, the direction of the banking shares will largely determine the direction of the XJO index.
Our base case has been that the major banks will face challenges to grow revenue in the current market environment and that pricing risks are skewed to the downside.
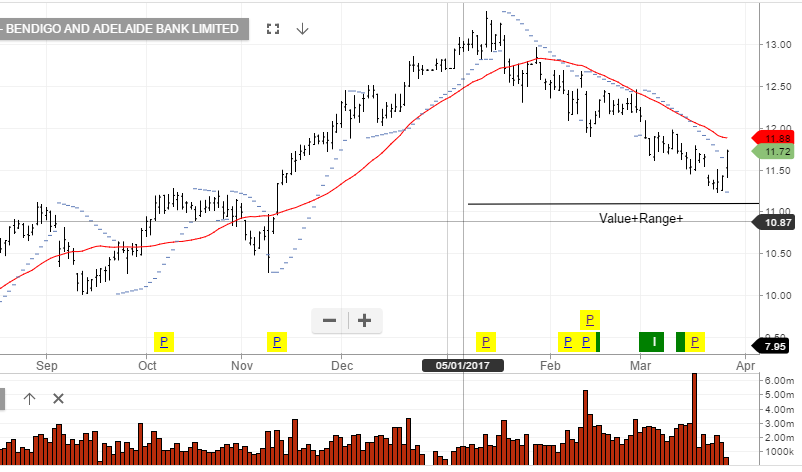
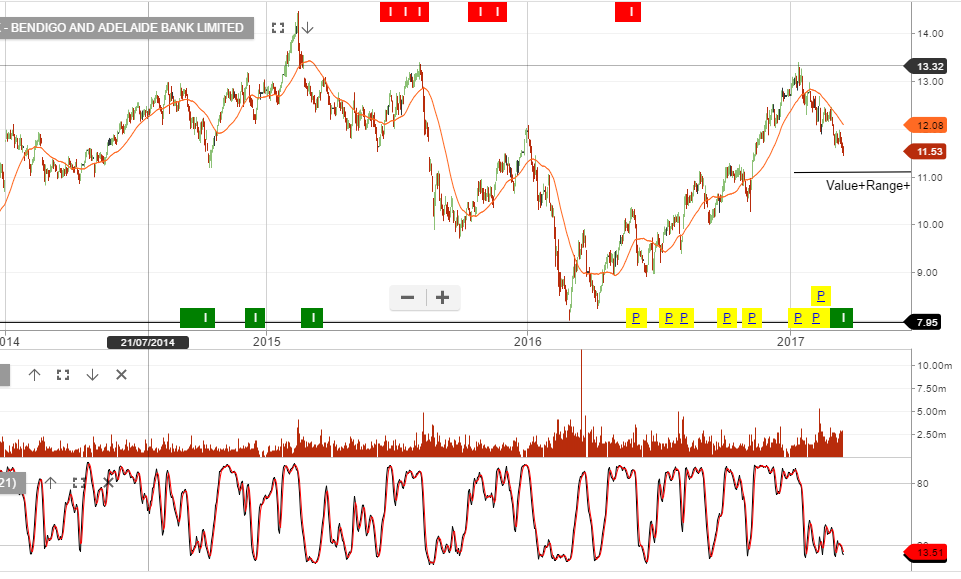
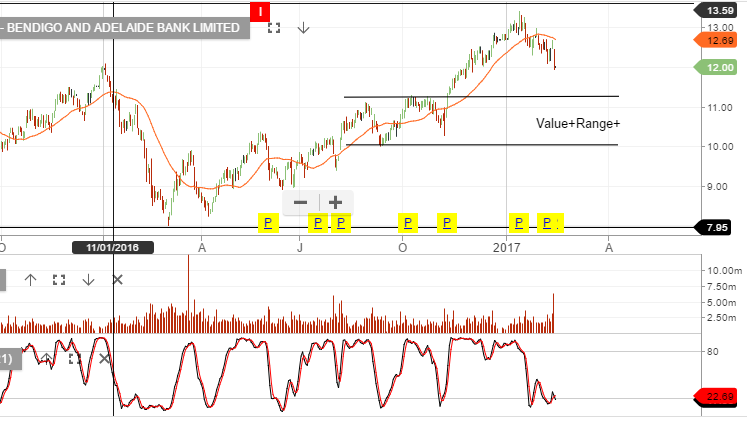
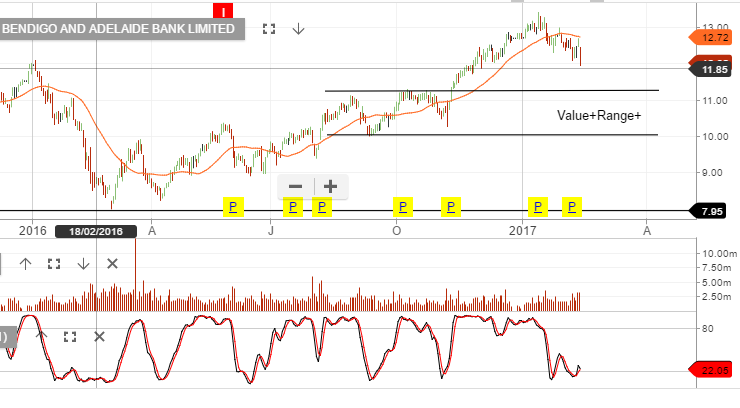
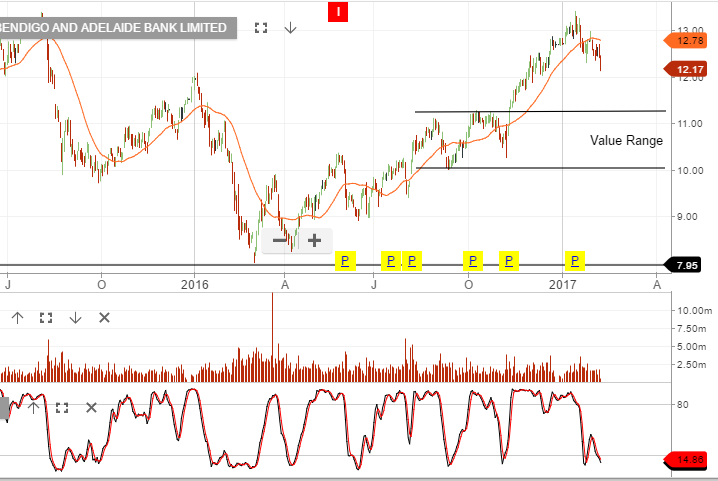
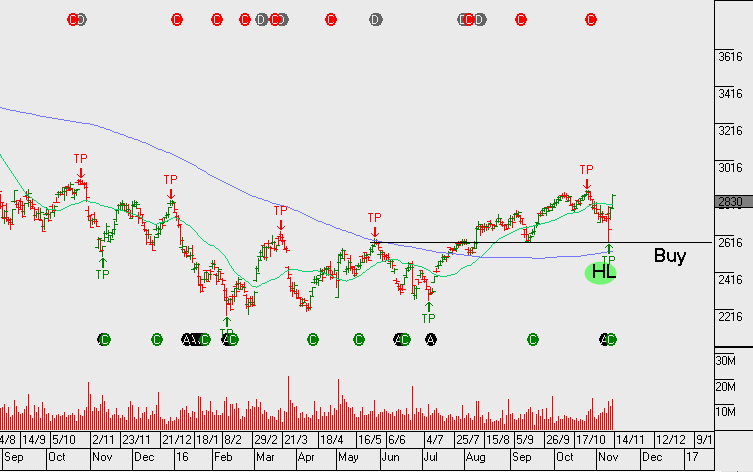
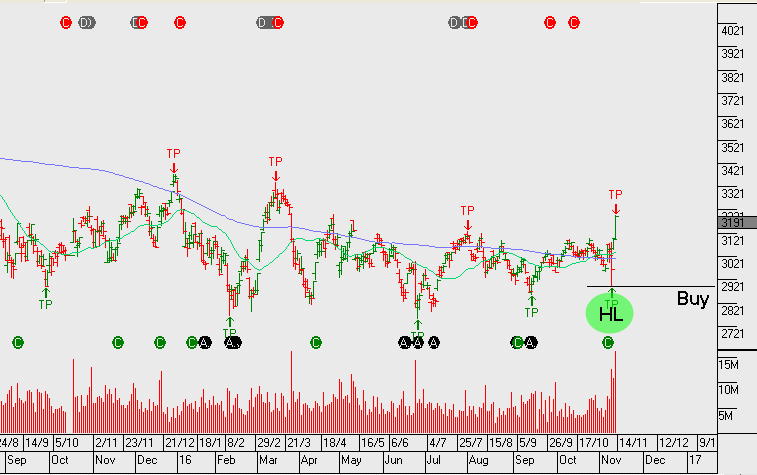
These valuation concerns apply even stronger to the regional banks; BOQ and BEN. After recent price rebounds in these two stocks, we believe that they could trade lower and reach $10.50 and $10.00, respectfully.
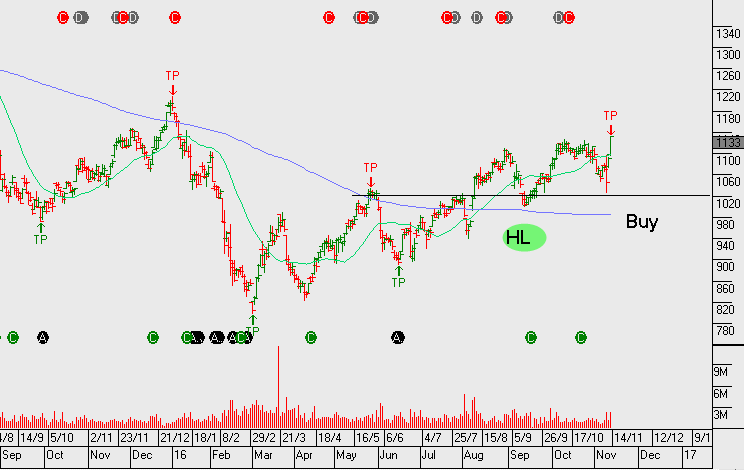
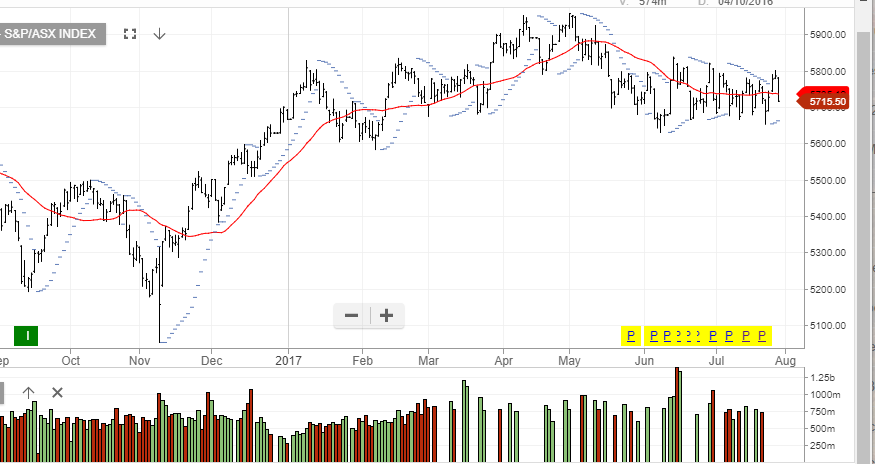 XJO
XJO
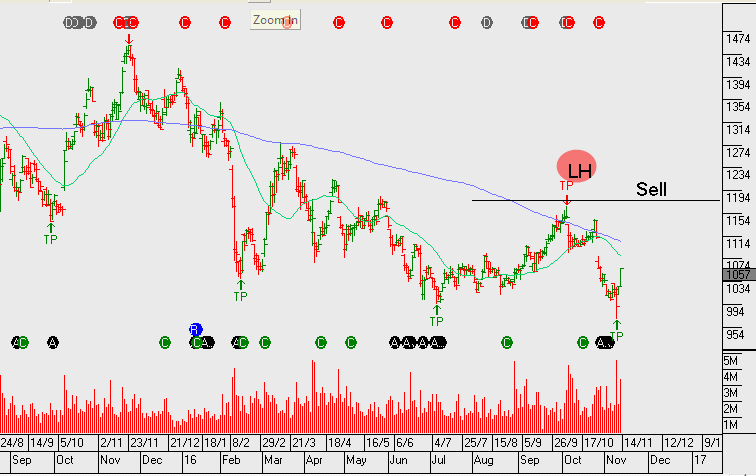
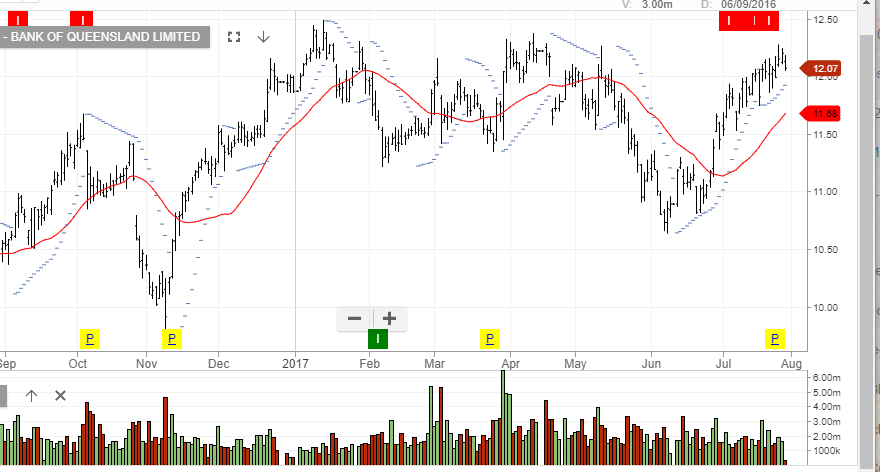 BOQ
BOQ
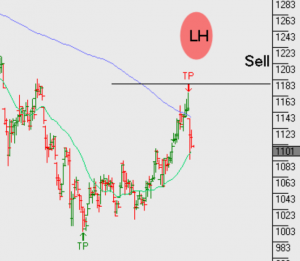
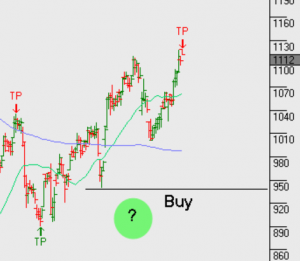
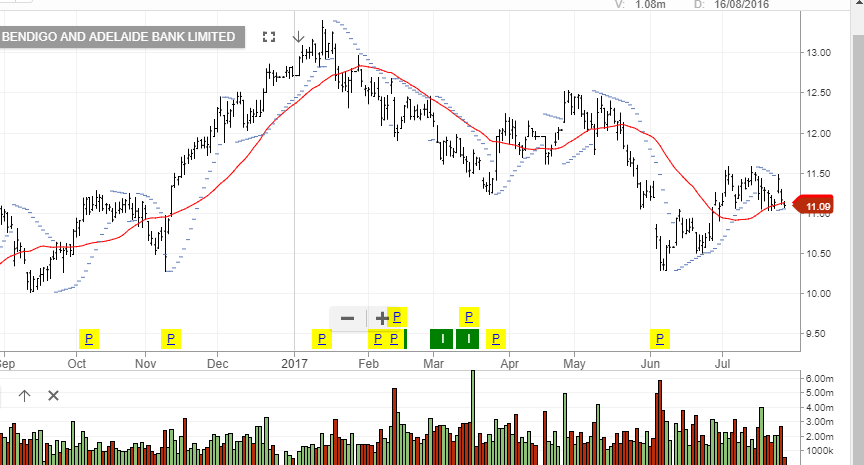 Bendigo
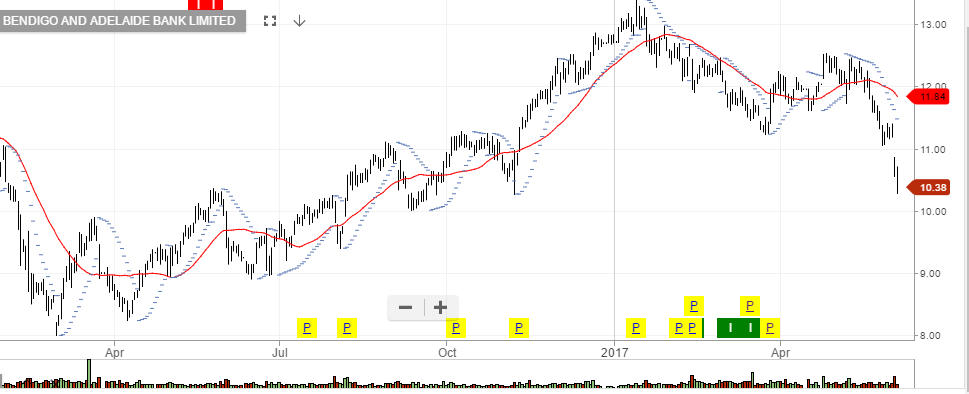 Bendigo and Adelaide Bank