BHP Assets Are In Play
Shares of BHP have opened firmly above $24.00 as overnight comments from Andrew Mackenzie confirm the company is likely to spin off some assets in the near-term.
Mackenzie was addressing a major mining conference in Barcelona when he gave the strongest indications yet that BHP might be giving ground to New York hedge fund Elliott Management’s aggressive bid to break up the mining giant.
As such, we see this development as underpinning the stock, even as Crude Oil and Iron ore prices remain in the lower end of their 6-month trading ranges.
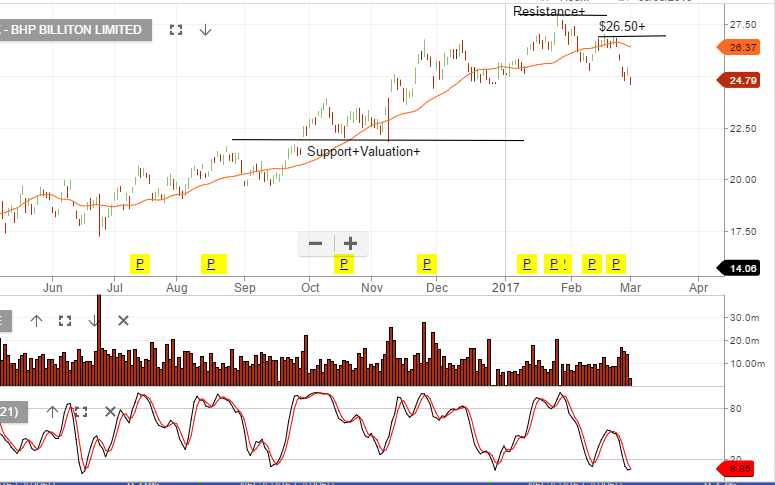
The ALGO engine triggered a buy signal for BHP on May 5th at 22.50. Over the last few days, we have suggest taking profits on long positions above $24.00 and looking to re-enter at lower levels.
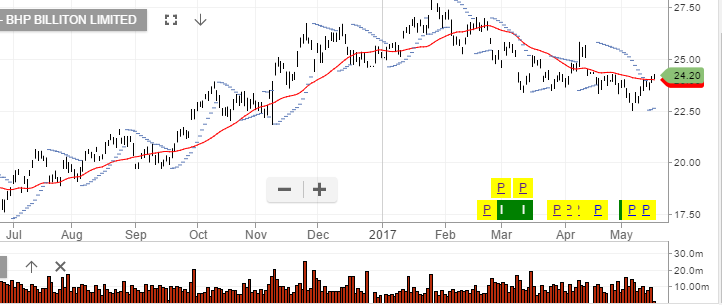
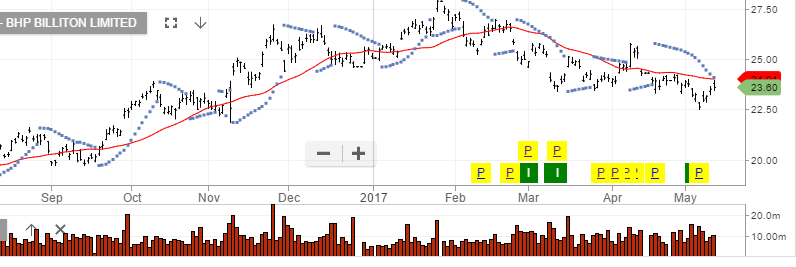
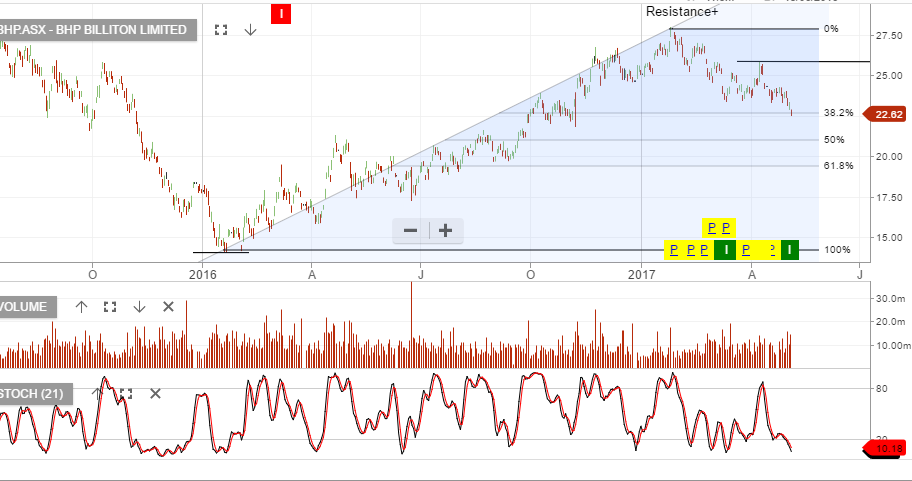
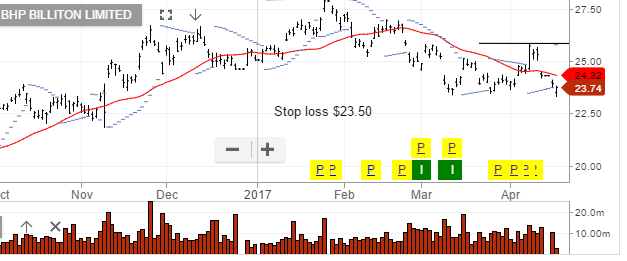
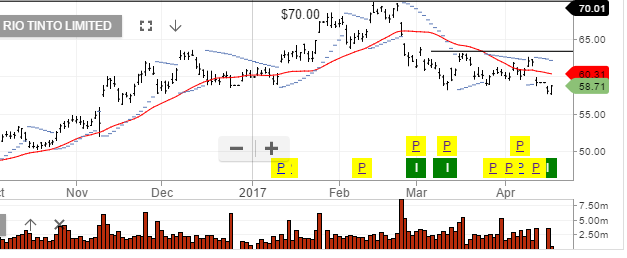
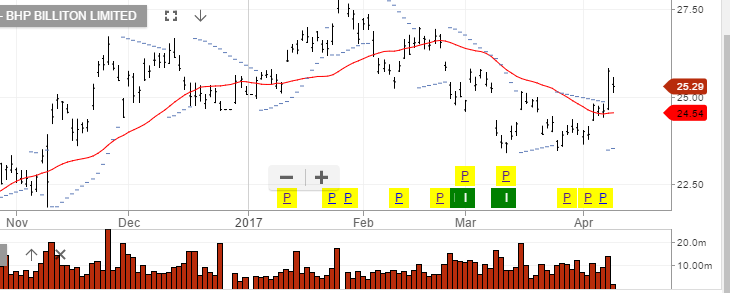 Chart BHP
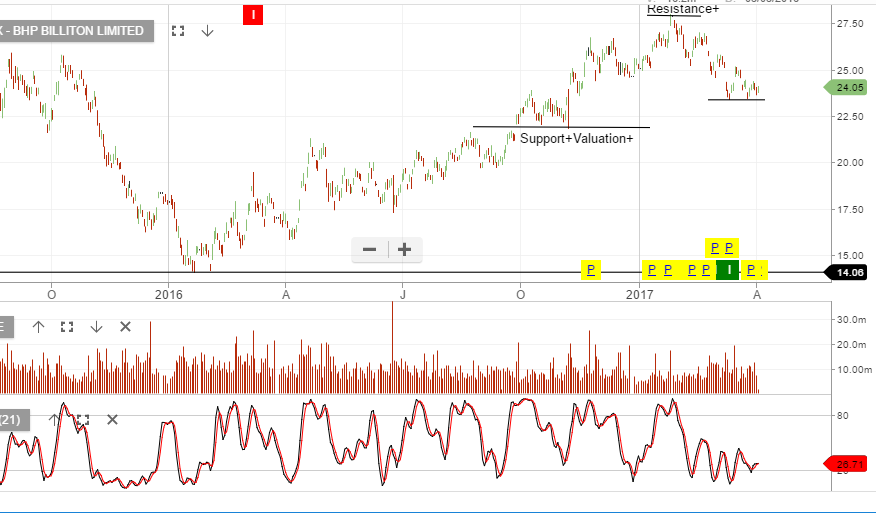
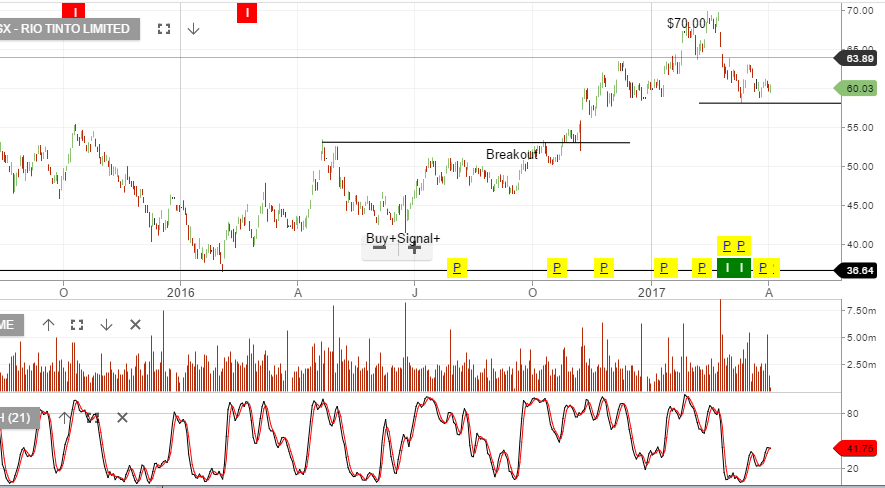
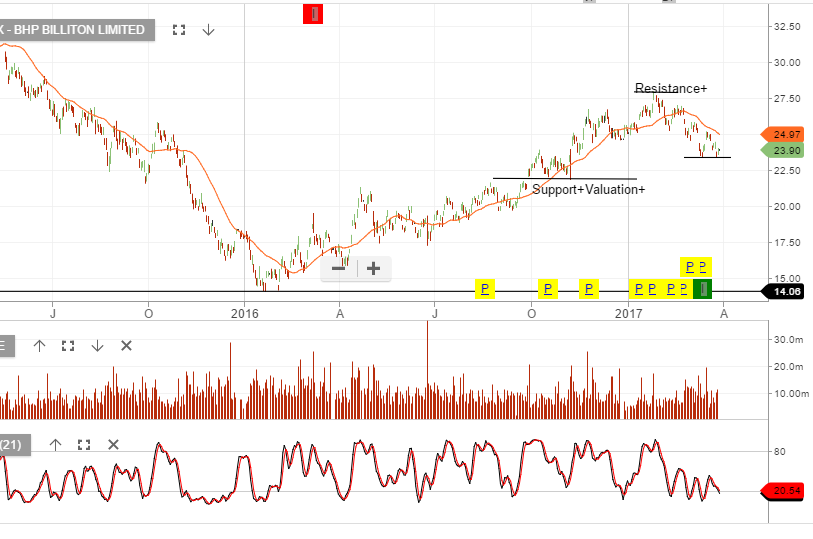
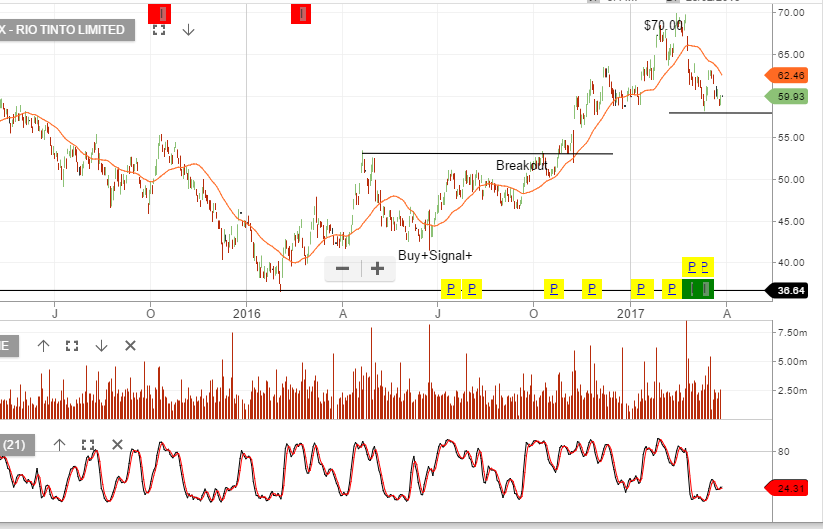
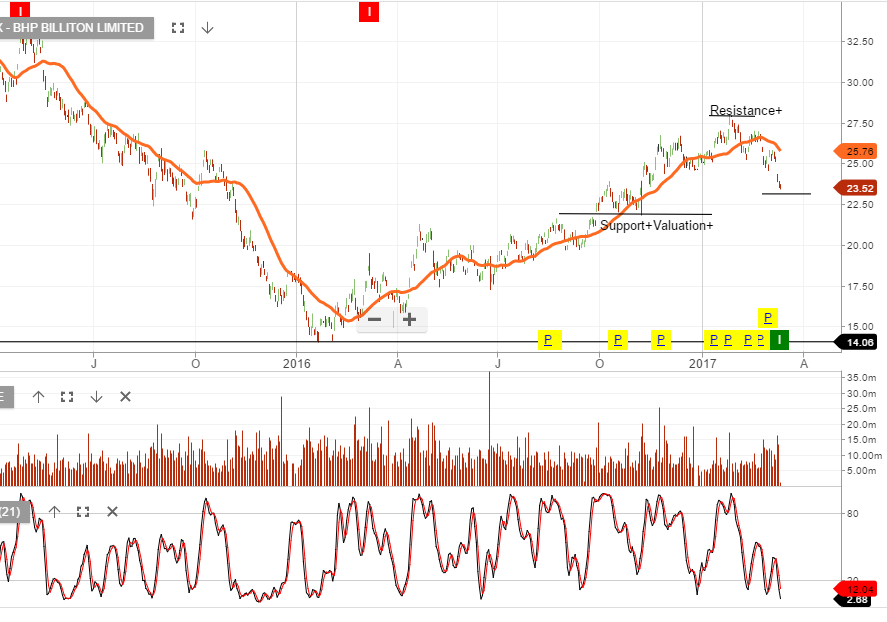 Chart – BHP