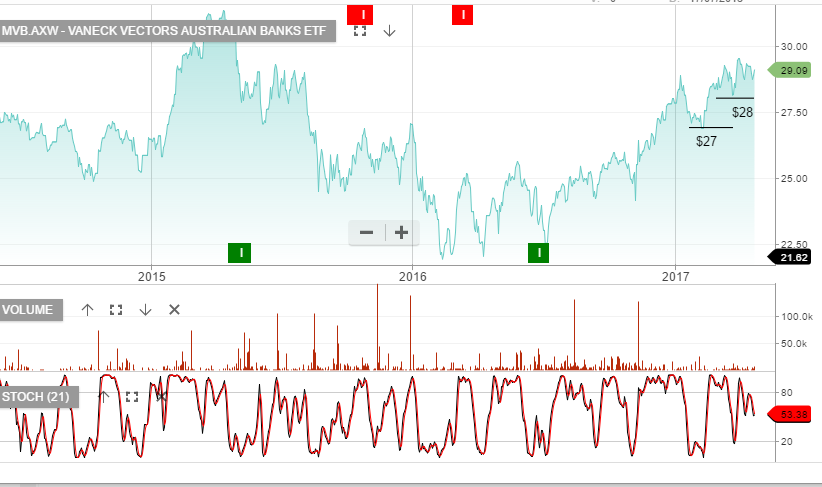
Australian Bank Earnings

On 2nd May, ANZ will report their half-year earnings. The market is expecting a net profit of around $3.7b and DPS for the half year of $0.80.

4th May, NAB will report their half-year earnings.  Net profit should be around $3.4b and DPS of $1.00.

5th May, Macquarie Bank reports. Net profit is expected to be similar to last year at $2.15b and DPS of $2.52

8th May, WBC report their half-year result. Net profit should be $4b and DPS $0.95

On average, the market is looking for approximately 3% underlying EPS growth among the banks and dividends to remain steady, or the same as the previous 12 months.

Charts – MVB (Vaneck Aust Bank ETF)


Higher Low Pattern Stocks to Add to Your Watchlist

The following group of stocks are in either established uptrends or, in recent months they’ve broken downtrends to begin building the early stages of a bullish “higher low” formation.

Many of these names have been mentioned previously in the blog and/or the monthly strategy video report. It’s worth loading these codes into your watch list and considering rebalancing your portfolio to include allocations towards some, or all of these names:

JHX, LLC, MQG, SHL, TWE, ANN, ANZ, ASX, CCL, CIM, COH, QUB, TAH, WOW & WPL.

With the lower growth names within the above basket, such as WOW & CCL, we compliment the position now with tight covered calls to enhance the yield to 10%+ per annum. With some of the other names, we give a little more breathing space as we expect 5 to 10% price appreciation before selling the call option overlay.


Macquarie Group 1H16 Earnings

Despite a 2% fall in earnings for the first half of 2016, Maquarie Group announced an interim dividend of $1.90 per share, up from $1.60 per share in the corresponding period last year and above market estimates for a $1.73 per share dividend.

The investment bank also reaffirmed its guidance for the full year, with expectations of matching the the record $2.06 billion profit it posted in fiscal 2016. For the six months to September 30, the bank recorded earnings of $1.05 billion, down 1.9% from the same period last year but materially better than the forecasts of a drop to $994.5 million.

Macquarie’s tier 1 capital ratio was seen at 10.4% versus 10.7% when it last reported in May, while assets under management rose 3% to $493.1 billion. The modest decline in earnings was driven by an 18% drop in net interest and trading income and a 21% slump in fee and commissions down to $2.2 billion.

As long as the group meets its own forward forecasts that FY 17 will be broadly in line with FY 16 results, the share price valuation will remain reasonable at 12.5X forward earnings for a 5.5% dividend yield.

With around 60% of its total expected income to be earned overseas in H1 17, the company could get a bit of a tailwind if the Australian Dollar continues to track lower versus the US Dollar over the next six months.

mqg
Chart – Macquarie Group