US vs Australian Bank Performance
There is a saying in the financial markets that a “rising tide floats all boats” This old adage has been used recently to describe how the rally in US bank shares has lifted the share prices of Australian banks.
Since November 4th, shares of Citibank have gained 14%, shares of JP Morgan have gained 16%, shares of Bank of America have risen by 17% and Goldman Sachs shares have rallied by over 20%.
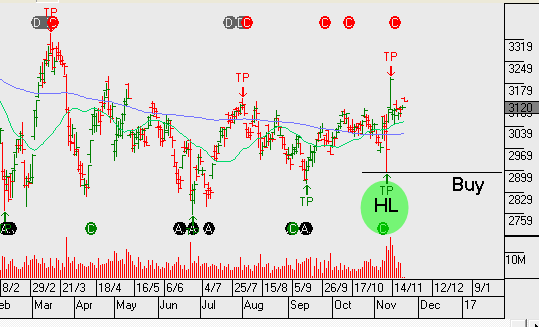
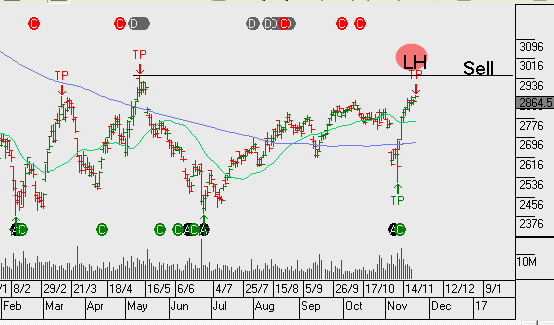
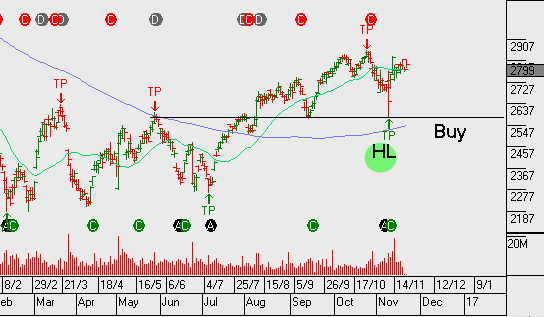
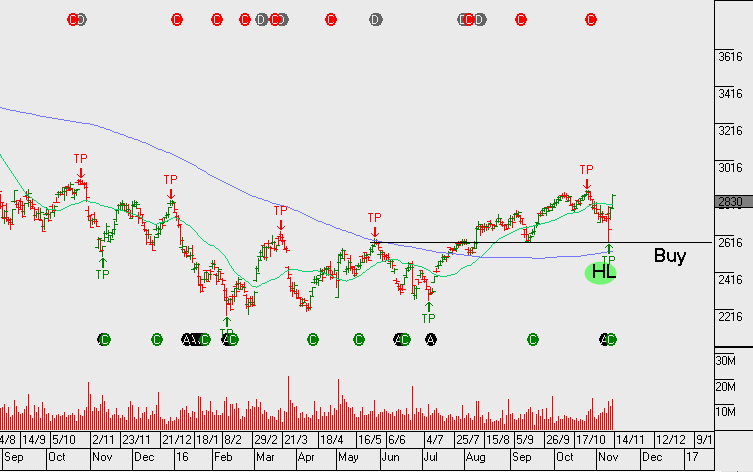
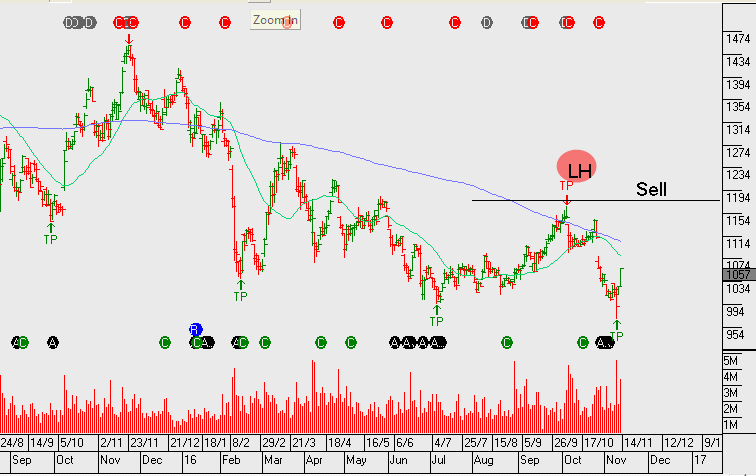
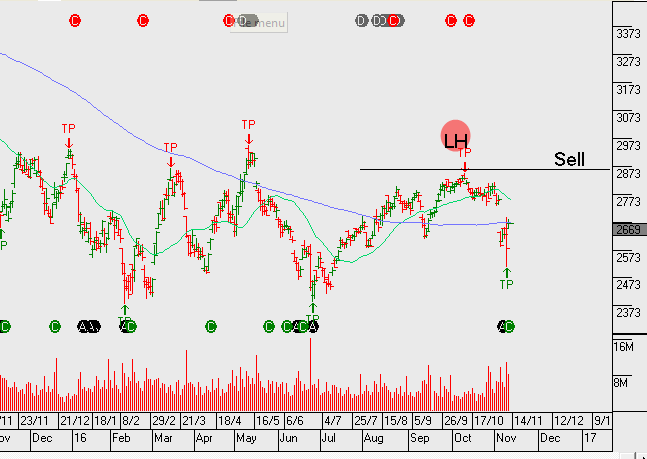
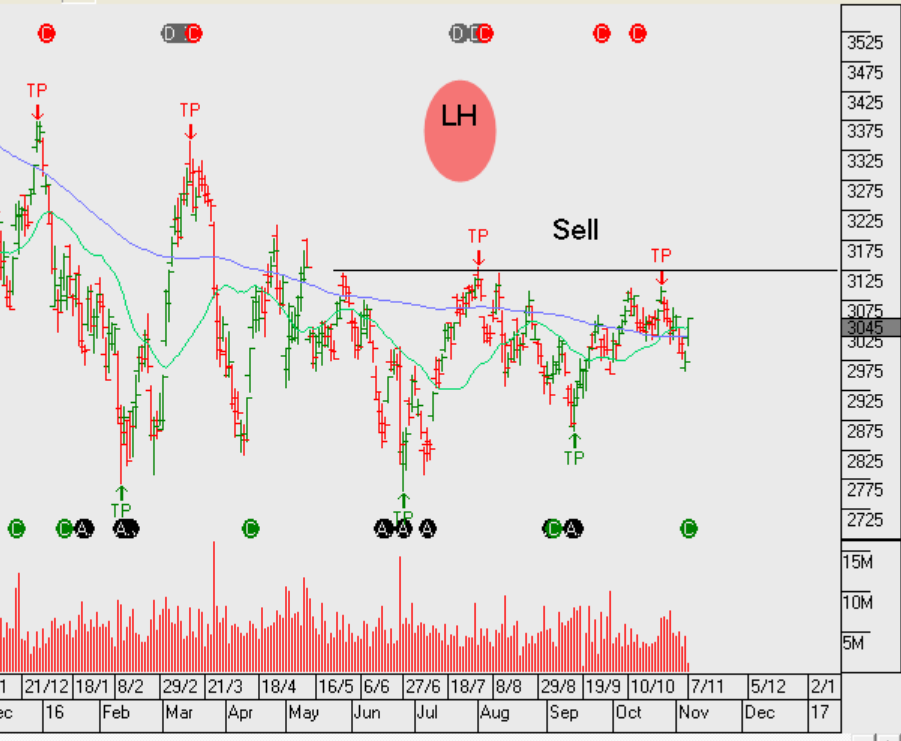
Over the same period of time, shares of ANZ have gained 6%, shares of Westpac have gained 8%, CBA shares have lifted by 8.5% and shares of the NAB have rallied by 11%.
Interest rates in the US began bottoming out in late September, which was positive news for most US financial names. In addition, the election of Donald Trump is being hailed as a “game changer” for the U.S. banking sector, as the Republican sweep of the White House and both houses of Congress appears to have shifted investor’s expectations about interest rates, regulation and the broader business environment.
With respect to the Australian banking names, these two key points aren’t applicable.
The RBA may have moved to a neutral bias on domestic interest rates, but there’s no realistic expectations for a rate hike anytime in the foreseeable future. And, if any regulatory changes are legislated in the Australian banking industry over the next 12 months, they are more likely to be restrictive, as opposed to accommodative.
With this in mind, we will use this recent rally in Australian banking names to implement our derivative overlay strategy and sell covered call options to enhance returns on bank share holdings.
Stay tuned to the Investor Signals daily blog for specific timing and price information.