XJO & Dow Jones – Chart Watch
The XJO is now in the early stages of a new minor low structure.
The XJO is now in the early stages of a new minor low structure.
US earnings season will go into full swing next week with several DOW components and high-capitalization S&P 500 companies reporting Q1 earnings.
Thus far, the results have been mixed with IBM missing badly and forward guidance on the major US banks showing concerns for future revenue growth.
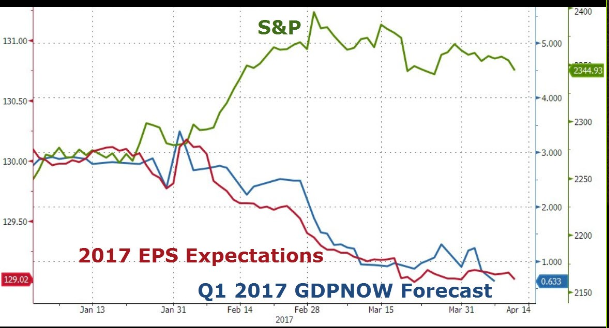
The chart below shows that the expectations of S&P earnings, relative to the current pricing of the S&P 500 index, are very much out of line.
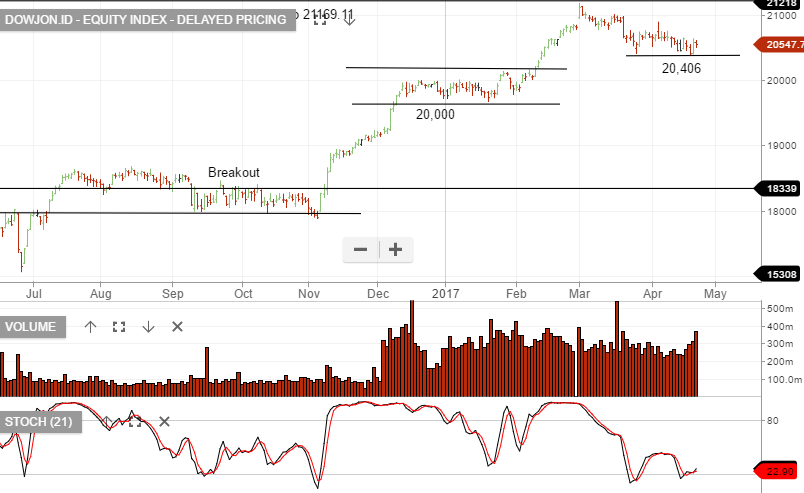
If next week’s earnings reports don’t exceed expectations, we could see further downside range extension on the SP 500 index, which could pressure the XJO index lower.
We have been looking at the May 5800 XJO puts as a short-term portfolio hedging instrument for a move lower in the local market.
We have also been buying the BetaShare BBOZ inverse exchange traded fund. Shares in BBOZ gain value as the local market trades lower.
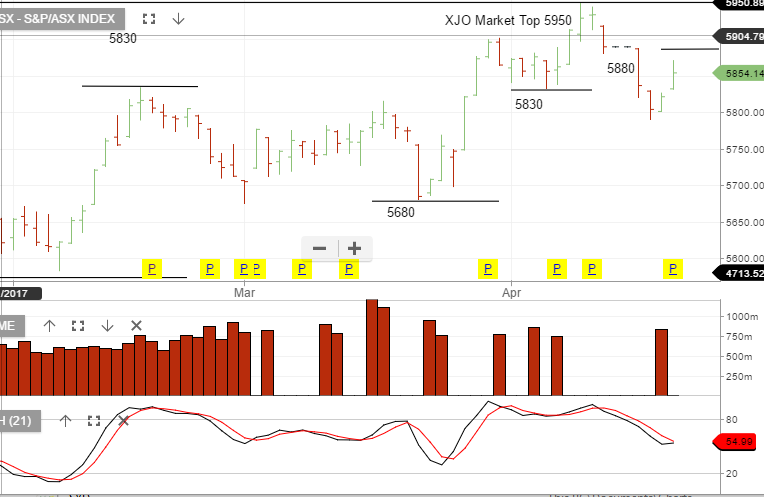
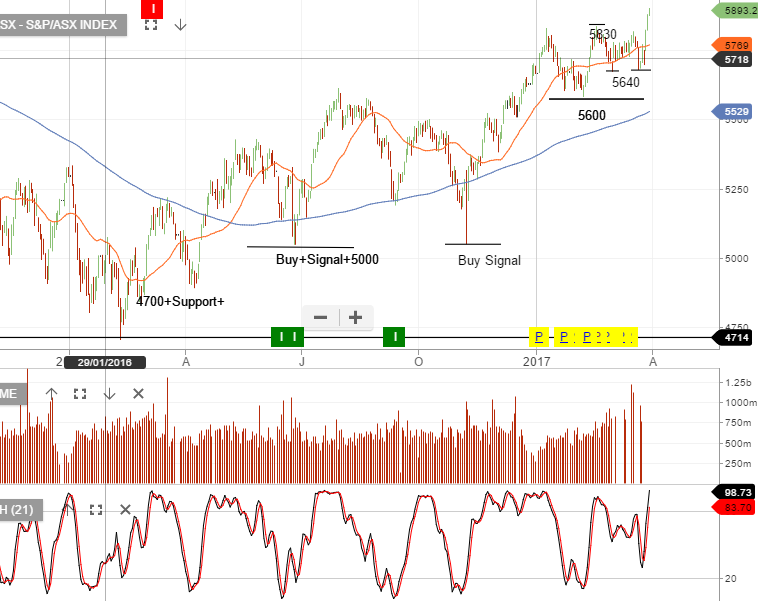
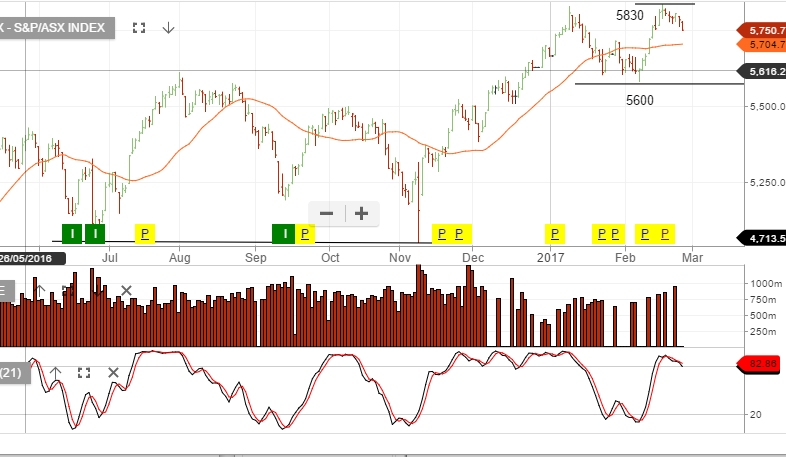
The XJO has found support on the resistance level of 5830. If we see the price action turn-down through this support range, we recommend investors increase their hedging exposure.
The XJO continues to make higher low formations with 5830 providing buying support throughout the past week. If we see price action break below 5830 and then form resistance, we’ll view this as the beginning of structural weakness for the local market.

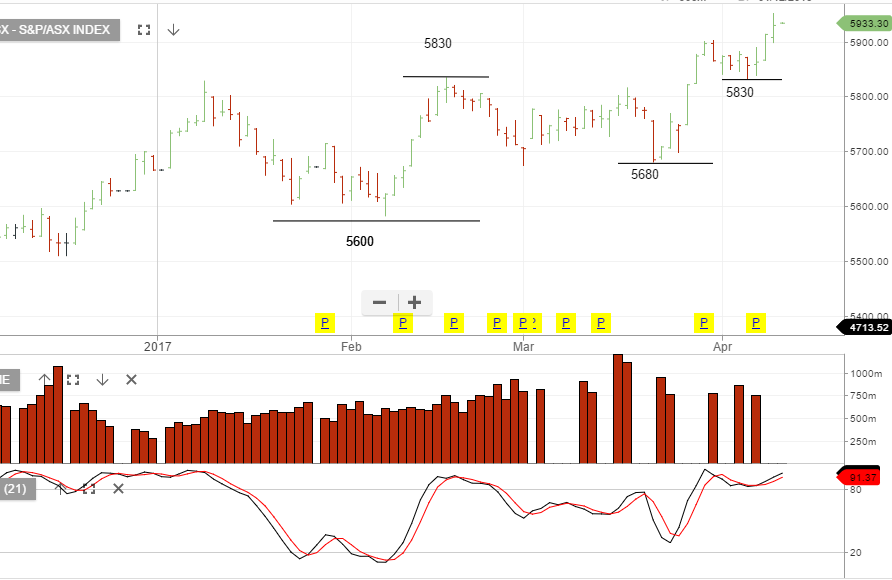
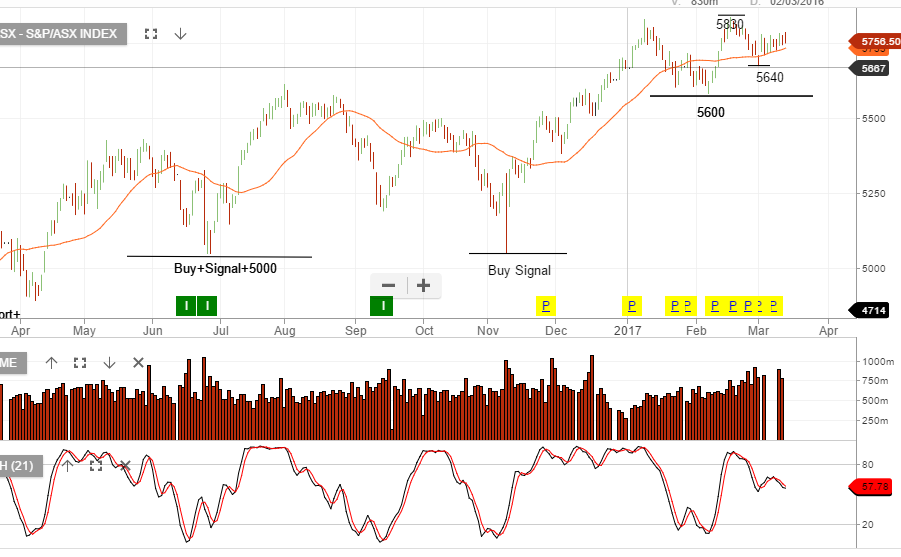
The XJO continues to push the upper range of the recent consolidation band. If the resource names can hold their current higher low formation, we may see further short-term strength in the index.
The following group of stocks have recently been flagged by our Algo Engine.
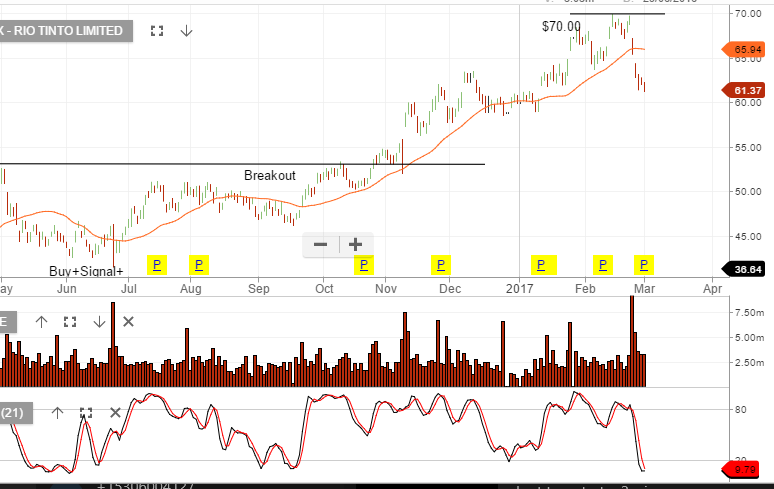
Algo buy signals include; BHP, RIO, FMG, S32 & QBE;
Algo sell signals include; NCM & OSH.
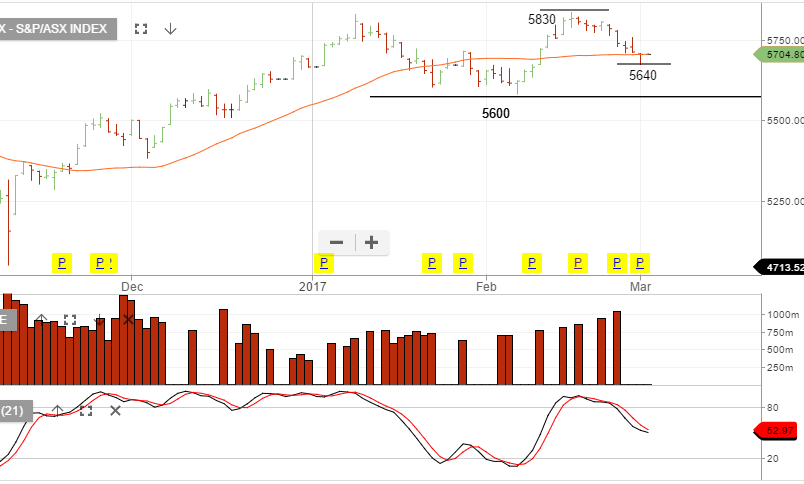
The XJO remains range bound with the most current level of support at 5640.

The XJO is creating a higher low formation with new support at 5640.
The XJO is now off 158 points from the 16/02/17 high of 5833. The resource sector has been the main drag, in particular, BHP and RIO.
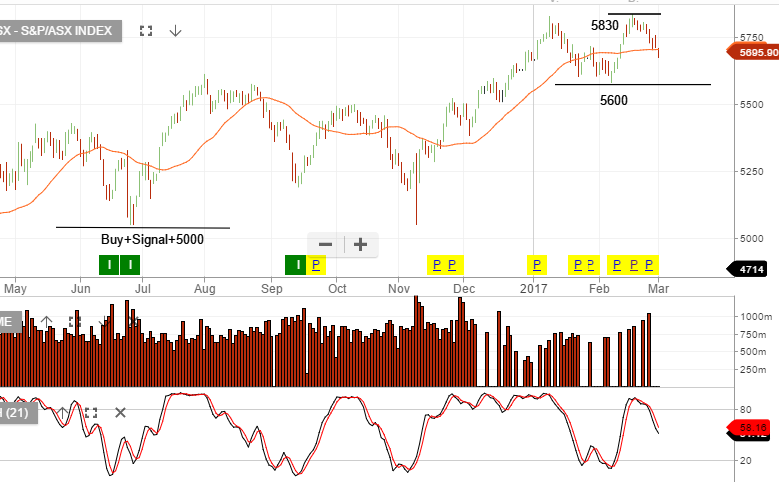
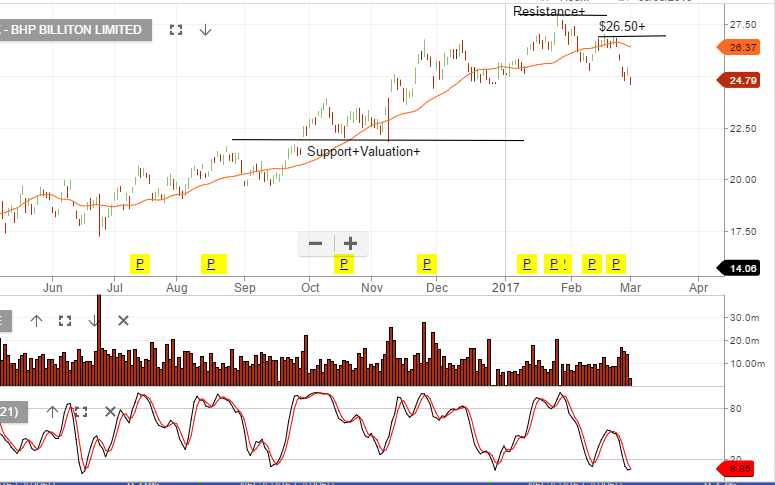
Chart – BHP
We’ve been cautious of the resource names rolling over from the recent highs and the potential negative impact on the overall XJO index. It appears that the broader Australian market may be in the early stages of a price correction.
Also, the Australian banks appear fully valued given the low revenue and profit growth outlook across the next 12 to 18 months.
Level 17 Chifley Tower
2 Chifley Square
Sydney, NSW 2000
1300 614 002
Investor Signals Pty Ltd
ABN 44 143 555 453