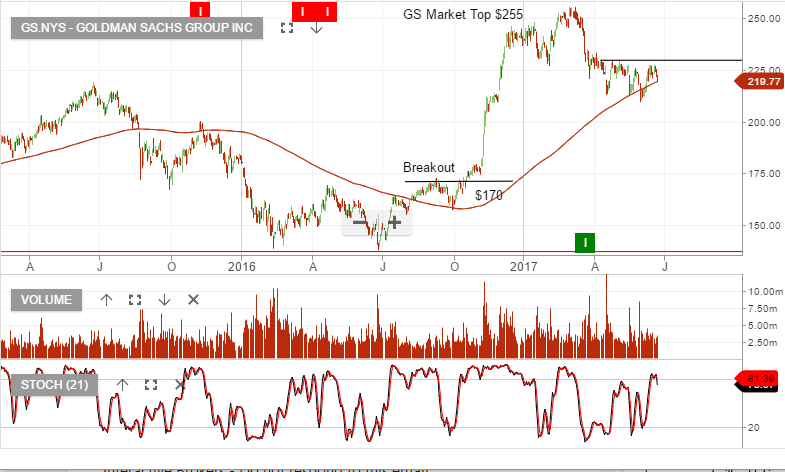
We’re watching the rebound in US financials as a leading indicator for momentum in the Australian banking shares.
The chart below of Goldman Sachs shows the minor bounce that’s recently taken place. However, it looks like selling pressure is now building and the short term momentum indicators have turned lower.
Unless, Goldman Sachs can trade back up through the $230 resistance, it looks like the rebound higher, could now be completed.