If a picture tells a thousand words, maybe nothing more needs to be said?
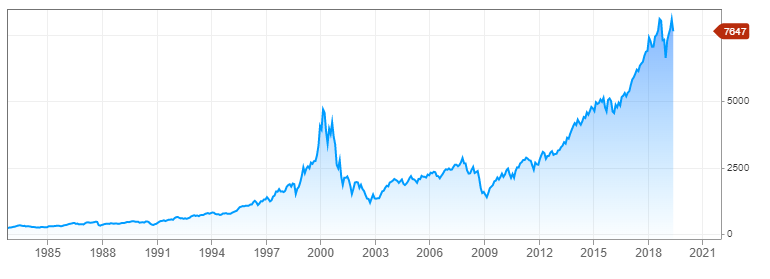
Long-Term graph of the NASDAQ.
US Markets are muddling through the March quarter earnings as investors grapple with a weak earnings picture and trade tariff related issues. The bar was lowered significantly heading into the March quarter earnings season. Where consensus expectations were looking for -5% EPS growth, we’re now 75% of the way through the S&P500 earnings and the average EPS is tracking around -1%.
The graph above of the long-term pattern in the NASDAQ, highlights where investors’ concerns should be pointed. Elevated PE ratios in an environment of flat to contracting earnings could soon become a big problem, especially for technology stocks where in some instances there is little to no profit.
Short-term we’re watching the 10 day average on the NASDAQ and highlight last night’s close below the average. Longer-term, we remain cognizant of the need for the NASDAQ index to revert to the mean.
For more detail, please call our office on 1300 614 002.