The AUD/USD reached a 2.5 year high of .8065 last week.
Comments from RBA chief, Philip Lowe, that the central bank is not compelled to follow the USA’s higher interest rate policy only had a temporary effect on the Aussie.
This week’s data calendar has several potentially market moving reports.
The RBA is not expected to adjust interest rates on Tuesday. However, if the board re-affirms their neutral-to-easing bias, the AUD/USD could retreat from recent highs.
Wednesday’s building approval data is usually a second-tier report but will be closely watched this month.
Thursday’s trade balance numbers are expected to remain in surplus, but the $1.77 billion consensus number is half of last month’s amount. This release would not have included the recent rally in the AUD, which would have a dampening effect on exports.
Friday’s Retail Sales data will have more impact on ASX stocks than the AUD. The forecast is an increase of .2%, which will keep the yearly sales pace barely in positive territory.
On balance, we expect the RBA and trade balance numbers to weigh on the AUD/USD, and potentially turn the trend back to the downside.
Investors looking to profit from the AUD/USD trading lower can look to buy the BetaShare ETF with the symbol: YANK.
YANK is an inverse ETF, which means the unit price increases as the price of the AUD/USD decreases. YANK also has a 2.5% weighting, which means a 1% change in the AUD/USD will correspond to a 2.5% move in the unit price.
The current price of YANK is $12.60. We calculate that when the AUD/USD trades back to the January low near .7300, the unit price will trade at $16.75.
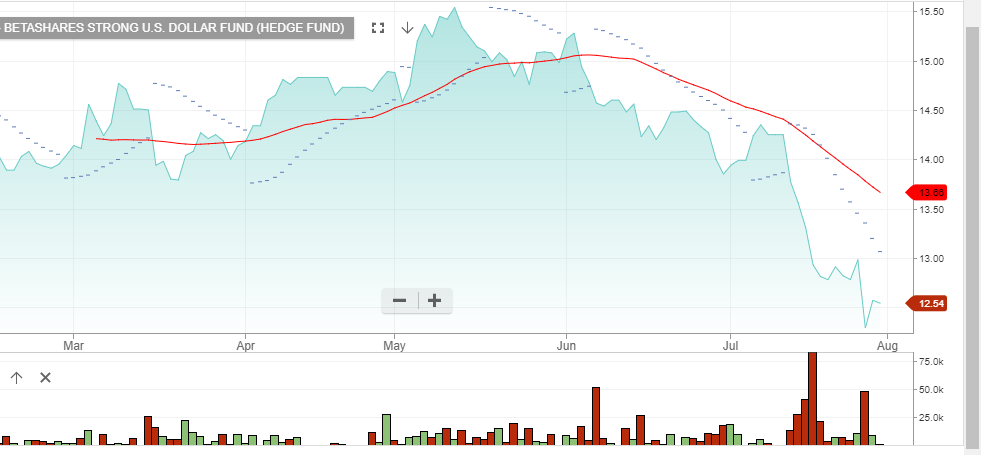
BetaShare ETF: YANK
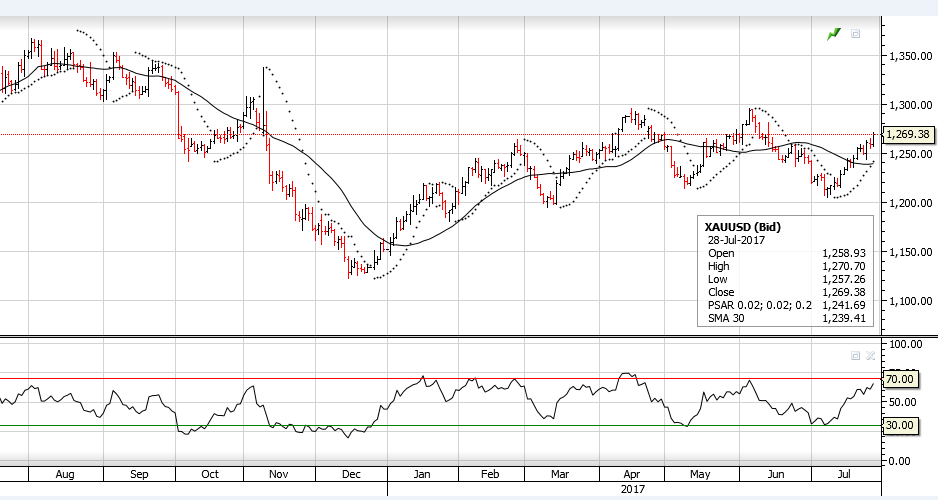 Gold
Gold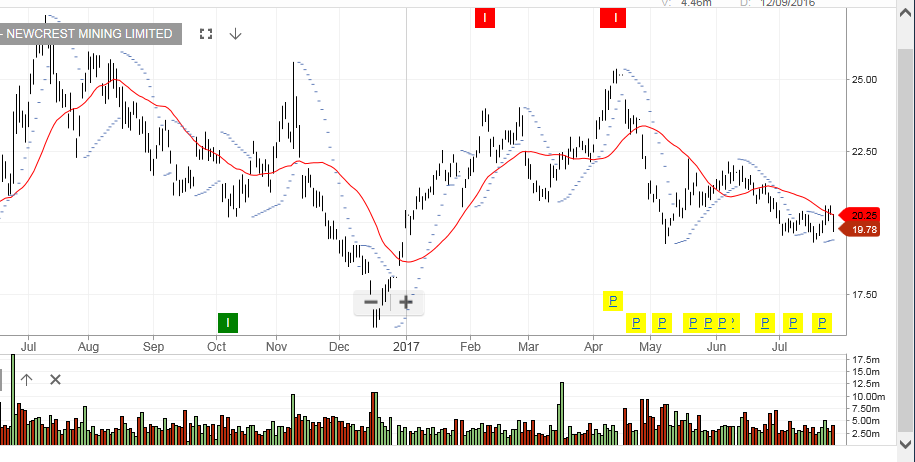 Newcrest.
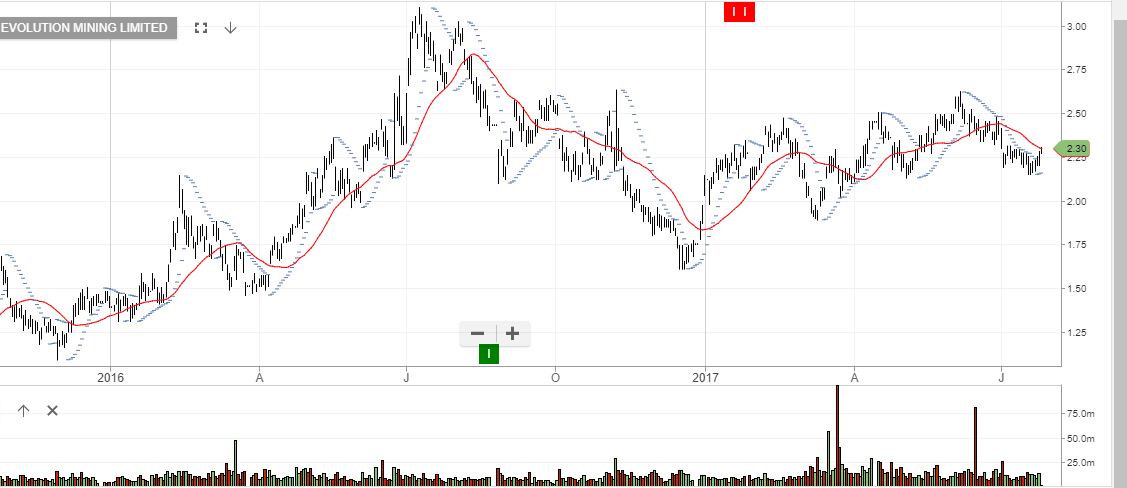
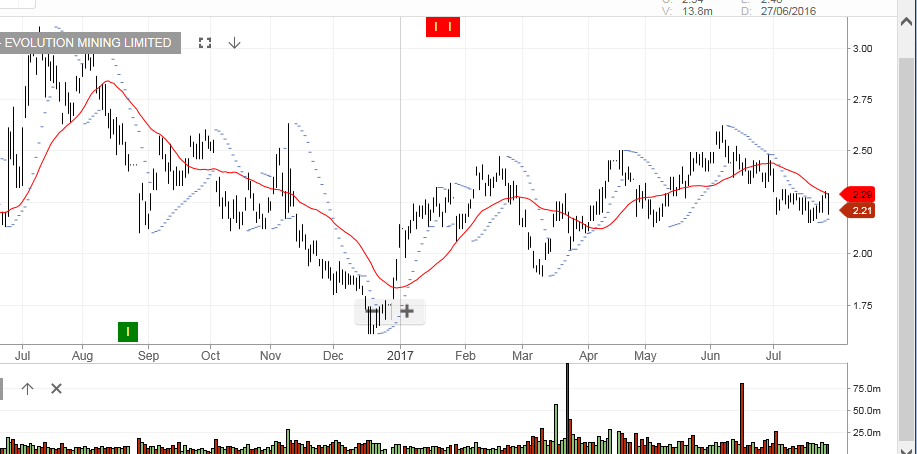 Evolution Mining
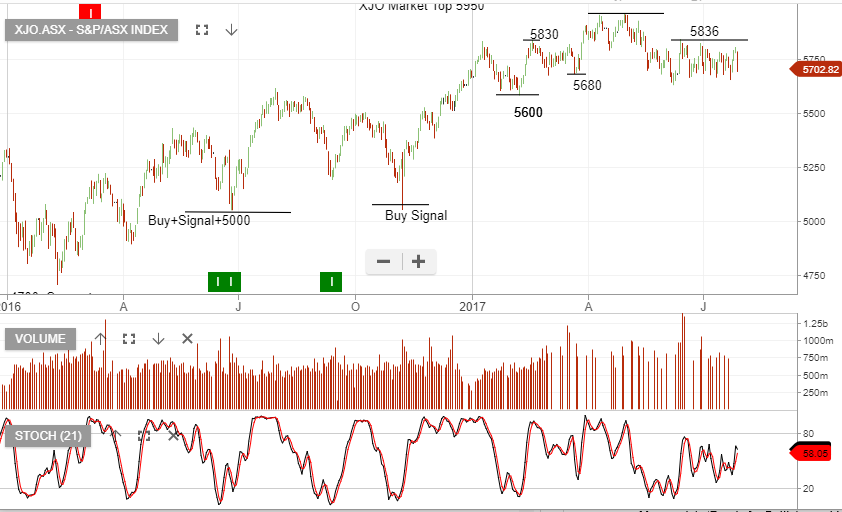
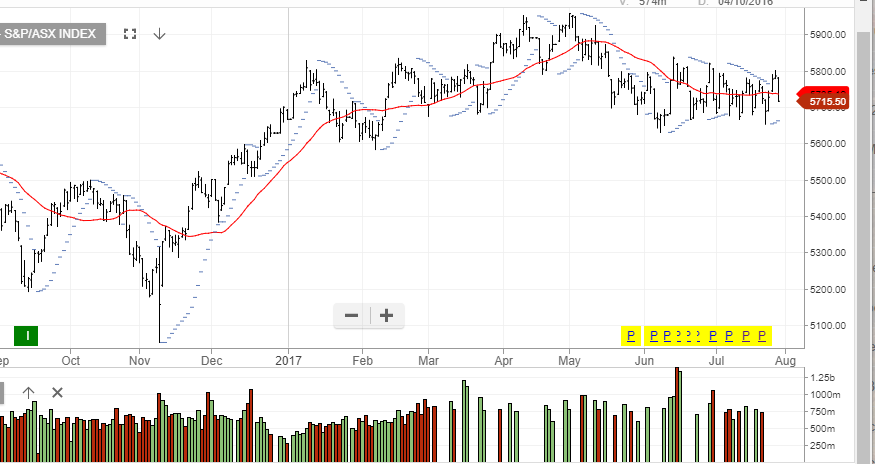 XJO
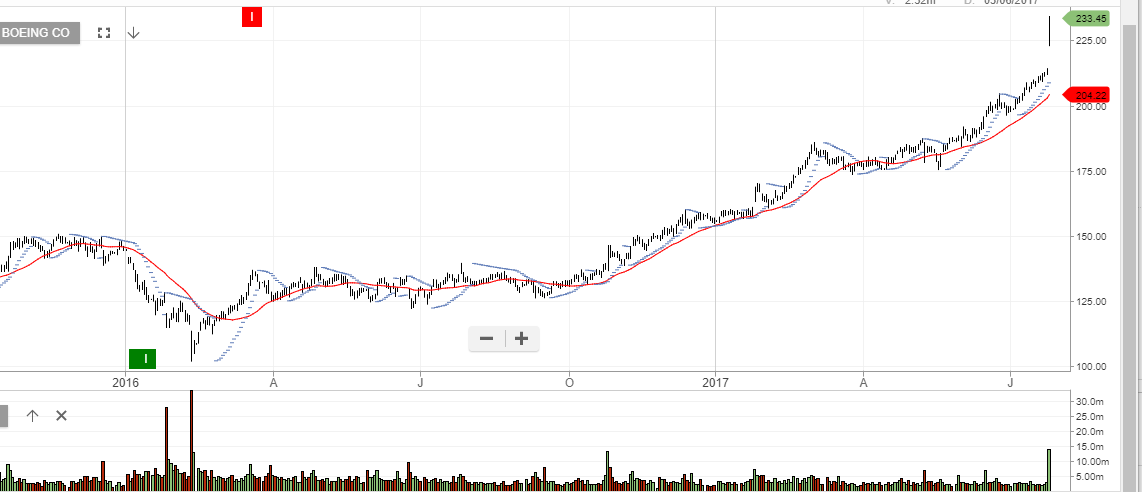
XJO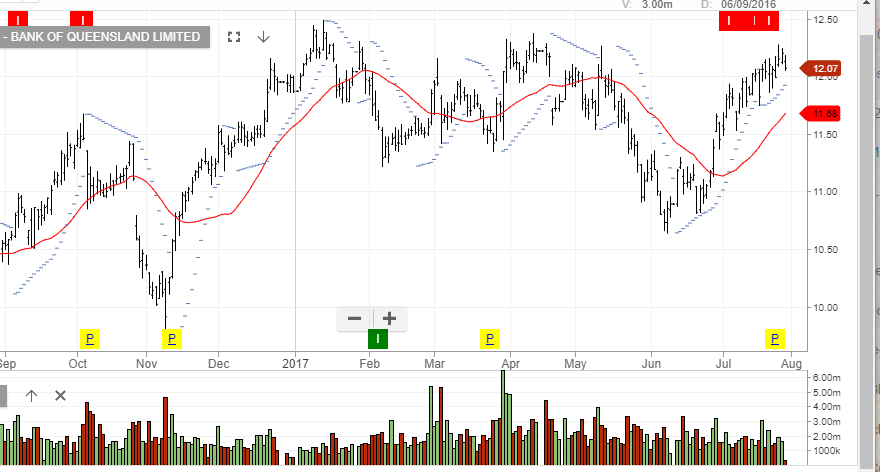 BOQ
BOQ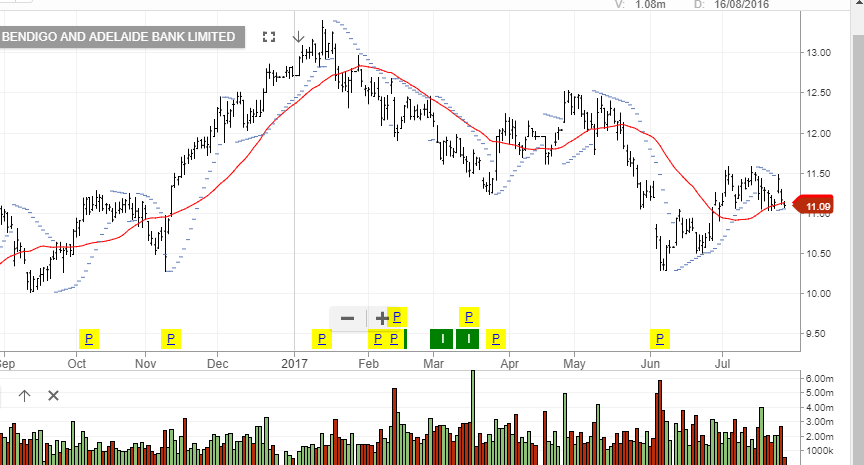 Bendigo