US Stock Market Outlook

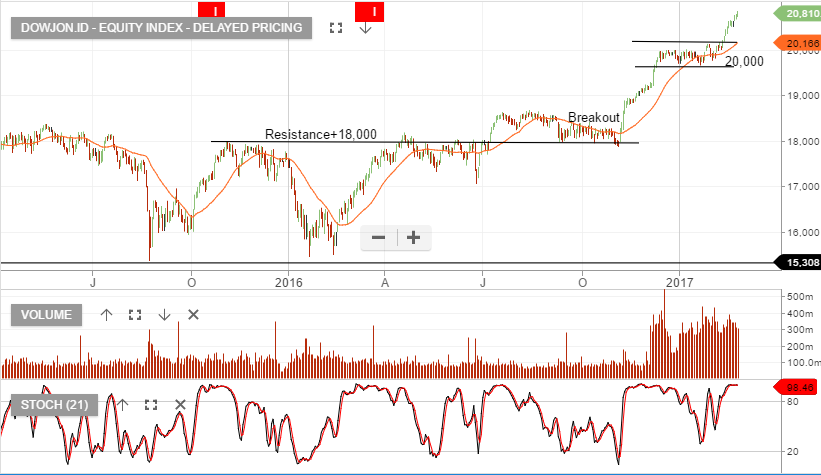
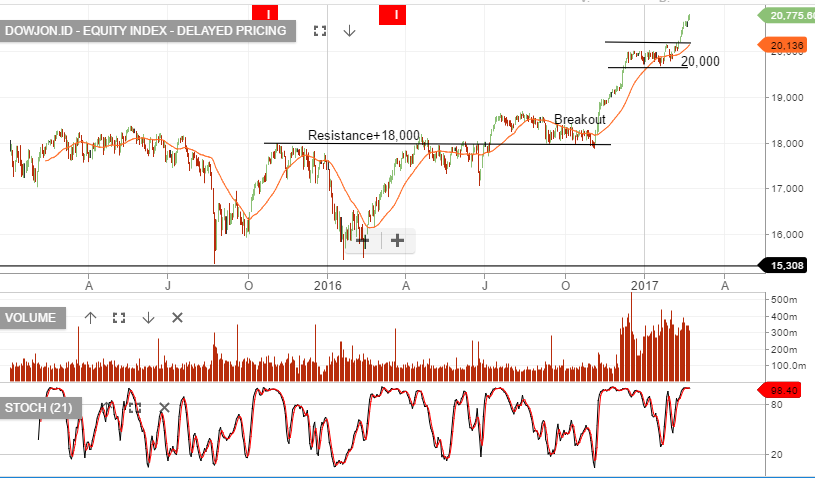
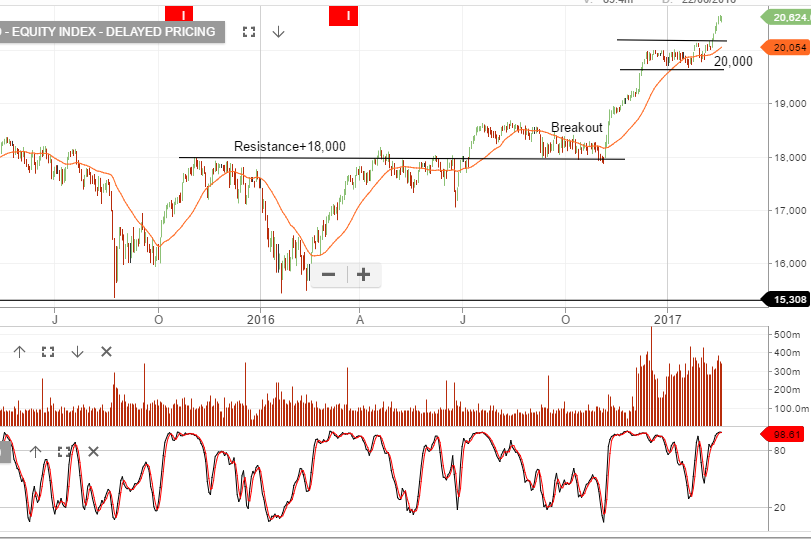
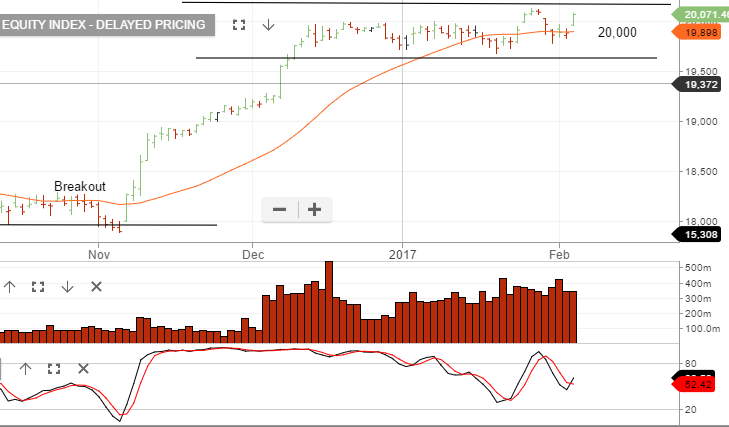
A late push on Wall Street helped US Stocks recover and allow the DOW JONES 30 Index to extend its winning streak to an 11th day.

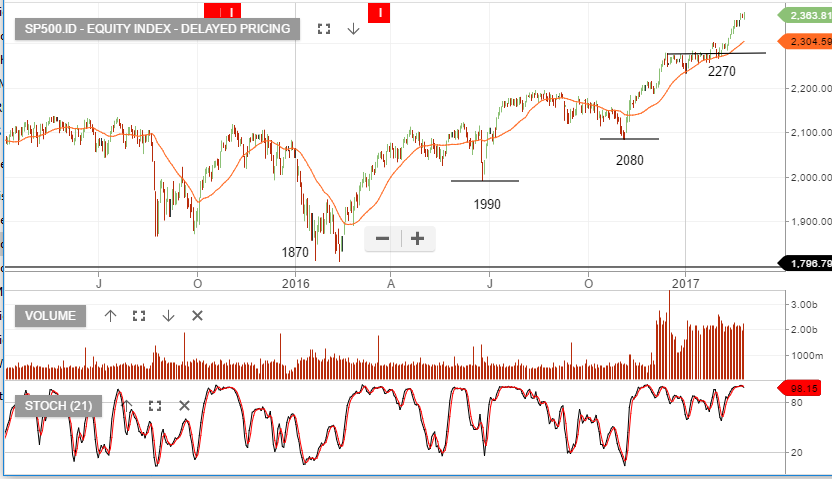
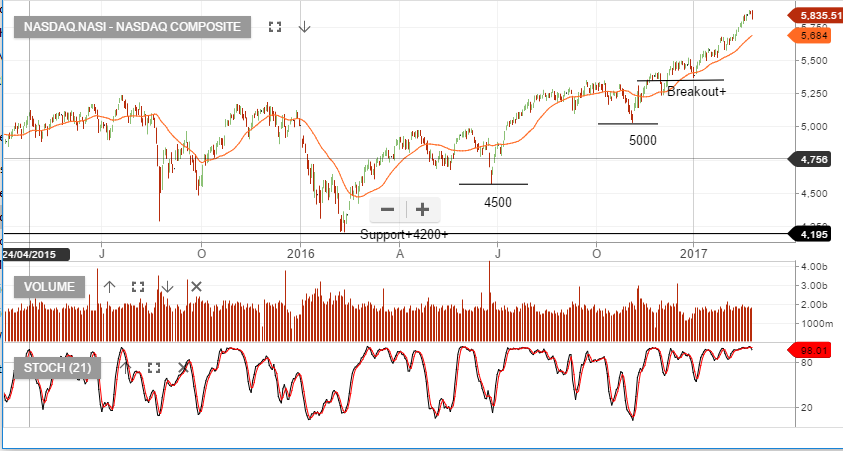
For the week, the DOW rose 1%, the SP 500 picked up 0.7% and the NASDAQ closed out the week pretty much unchanged.

Looking ahead to next week, President Trump will deliver a speech before a joint session of Congress, when he is expected to give more details about his tax plan, trade policies and the direction of health care in the USA.

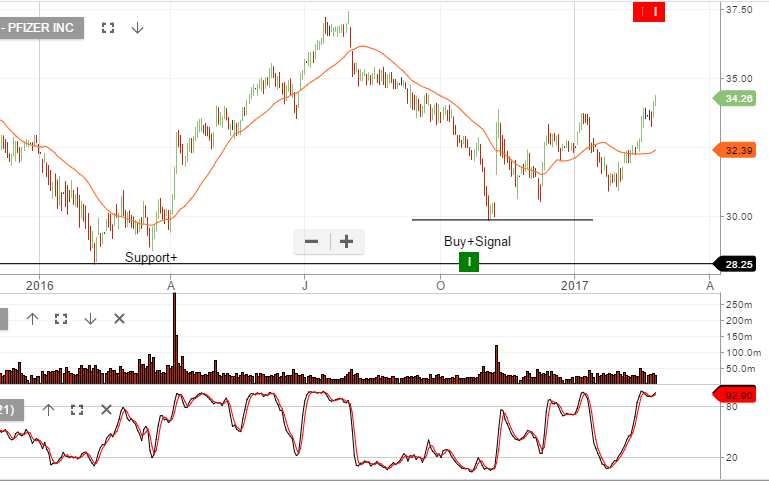
It’s interesting to see that the Investor Signals ALGO engine gave a sell signal for 2 pharmaceutical companies  today: Eli Lilly (LLY) and Pfizer (PFE). Those sell signals were posted at $82.85 and $34.25, respectfully.

US Drug companies have shown weakness on Mr Trump’s comments about health care reform in the past and investors will be listening closely to his speech on Tuesday.

Chart – Pfizer


US Equity Markets

The DOW Jones 30 Index posted its 10th straight winning day in a row overnight. The fact that each one of those 10 winning days was a new record high has not been achieved since 1987.

This most recent leg higher in Dow started on November 8th, after the result of the US election. Since then, the DOW has gained 2,515 points, or 13.75%.

A widely held theme for the US equity rally has been the reflation of the US economy under a more business-friendly administration. This reflation theme was largely based on across the board tax cuts and a country-wide infrastructure construction plan.

The idea being that these new policy measures would stimulate growth and push inflation, interest rates and stock prices higher. Along these lines, the yield on the US 10-year note climbed over 83 basis points, or 6%, from mid-November to late December.

However, over the last several weeks, the US yields have stopped moving higher and the Treasury curve has stopped steepening. In fact, over the last 10 day rally in the DOW, yields on the 10-year notes have actually dropped from 2.48% to 2.37%.

In short, while the DOW has firmed to new highs over the last 10 sessions, the inflation part of the reflation trade is beginning to fade.

From a traditional value-metric point of view, if the recent move higher in US stocks were signalling a new leg higher in valuations, we would have expected the 10-year yields to have traded higher, not lower.

Chart – Dow Jones
S&P500
Chart – NASDAQ
Chart – US10YR


XJO & Dow Jones – Chart Update

The XJO remains near recent resistance as more than 50% of top 200 companies have reported their earnings. Average reported revenue is up 3.4% on the same time last year and underlying average profits are up 6%.

The Dow Jones chart shows the index breaking to the upside of the recent 20,000 consolidation range.

We remain cautious of the extended share price valuations and moderate underlying earnings growth.

For this reason we continue to tilt client portfolio’s towards defensive assets. We prefer reducing exposure to resource and banking stocks across the next quarter and increasing exposure to healthcare and consumer staples.

Our tight covered call overlay is boosting cash flow to 10 – 12% per year.

Chart – XJO
Chart – Dow Jones


Chart Update – Banks

Goldman Sachs and JP Morgan remain within the consolidation range which began in early December.

In our local market we’ve seen BOQ & BEN sell off 10% from the January peak-to-trough. NAB reported weak revenue growth and higher than expected expenses, leading to a 1% fall in profit.

CBA report their half year results on Wednesday, we expect NPAT of $4.8b and DPS $2.00. 3 – 5% underlying EPS growth on the same time last year.

ANZ corrected 10% from peak-to-trough.

We’ll watch the US banks in the weeks ahead to see which way they break from their current consolidation range.

Chart – Goldman Sachs
Chart – JP Morgan
Chart – CBA


Gold Catches Safe-Haven Bid

Spot Gold prices hit a 3-month high of USD 1,235.00 as geopolitical tensions increased the yellow metal’s safe haven appeal.

Political uncertainty regarding upcoming elections in Europe, the US and Iran exchanging threats and unstable banking sectors in Italy and Greece have all added to investors’ interest in Gold.

From a technical perspective, the next key price target is at the November 11th high of USD 1292.00. We would suggest exiting long positions in that area.

Shares of Newcrest Mining have followed the gold price higher and have rallied over $3.50 during the last eight trading sessions. We expect to see the $24.50 level offer the next area of resistance and look to exit long positions in that range.

Chart – NCM


Mixed Payroll Data Lifts The Dow

US January Non-Farm Payrolls increased 227,000, which was well above consensus expectations of around 175,000.

The December revision was little changed at 157,000 from the 156,000 reported last month and the three-month average increased to 183,000 from 148,000 previously.

Unemployment rose to 4.8% from 4.7% the previous month and compared with expectations of an unchanged rate on the month.

Average earnings rose 0.1% for the month and this was well below consensus forecasts for a 0.3% gain. The December increase in average earnings was also revised down to 0.2% from the originally reported 0.4%.

The annual increase in earnings, therefore, slowed to 2.5% from 2.9% previously and was well below the 2.9% expected rate.

The stronger headline jobs number combined with weaker wages reduced the pressure on the FOMC to raise rates at their March meeting. This is reflected in the Fed Funds futures market where the implied probability of a rate hike fell from 18% prior to the payroll data to 9% by the New York close.

This market sentiment that rates could stay “lower for longer” lifted US Stock Indexes with the Dow and SP 500 gaining just under 1% for the day and the NASDAQ adding just over .50%

Chart – Dow Jones

James Hardie

Shares of James Hardie have opened over 3% lower on an announcement that a weaker-than-expected December quarter has forced the company to cut earnings guidance.

Shares traded down to a 3-month low of $19.60 as the the company announced that the group’s net profits fell 6% to USD 52.6 million.

This prompted a warning that earnings for the financial year up to March  would come in at between USD 245 and USD 255 million, versus expectations of between USD 252 to USD 269 million.

Chart – James Hardie

Amazon Shares Lower On Weaker Guidance

Shares of Amazon are down over 4% to $805.40, in after-hours trade, as negative Q1 revenue guidance overshadowed a solid Q4 earnings report.

Q4 earnings were announced at $1.54 per share versus a consensus of $1.35 per share. Q4 revenues came in at $3.5 billion versus $3.6 billion, which reflects a 47% increase on a year-on-year basis.

The Q4 revenue miss disappointed shareholders, but the Q1 guidance miss is what is really driving the stock price lower.

The company gave Q1 guidance in the range of $33.25 to $35 billion, lower than the expected range of $34.52 billion to $36.95 billion.

Key chart support for Amazon is now seen at or near $700.00.

Chart – Amazon

Visa Hits All-Time High After Q1 Results

Q1 earnings results for Visa Inc. beat expectations on both the top and bottom lines.

Visa posted earnings of 86 cents per share on Q1 revenues of $4.5 billion. Analysts’ expectations were for earnings of 78 cents per share on Q1 revenues of 4.278 billion, the higher revenue number reflects a 25% increase on year-on-year basis.

Visa shares have rallied over 3% today to an all-time of 85.40 as payment growth came in at $1.9 trillion, up 47% on a year-on-year basis for the three months ending September 30, 2016.

Looking ahead, Visa affirmed its positive outlook with annual net revenue growth expected in the 16 to 18% range for 2017.