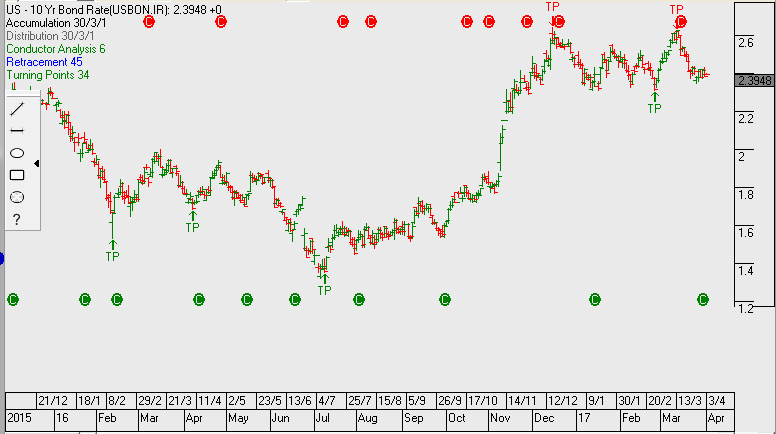
US 10YR Yields & TCL

The chart below shows the yield on the US 10YR bonds retracing from a high of 2.62% to now trading at 2.39%. We find this interesting given the positive commentary around US growth and market expectations for further rate rises in 2017.

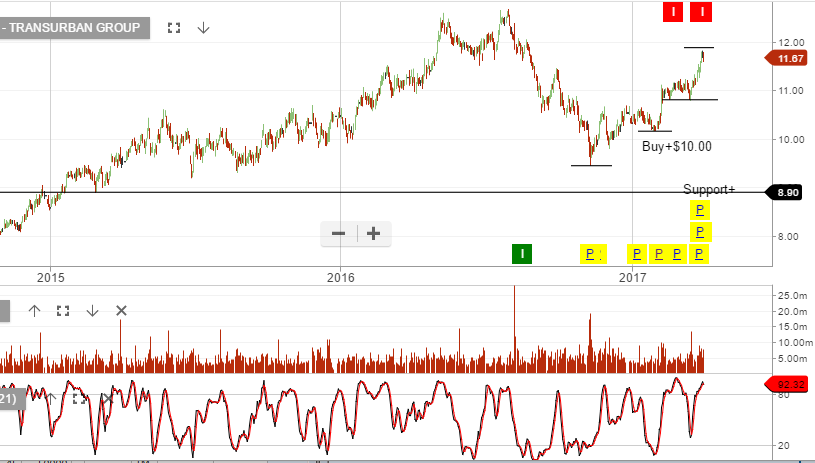
The by-product of the lower US yield story has manifested in domestic yield sensitive names such as Transurban being among the best performing stocks within the ASX50.

Chart – US 10YR
Chart – TCL

RBA Preview

There has been plenty of Central Bank action on interest rates around the world but none of it coming from the RBA.

That trend is very likely to continue at tomorrow’s RBA board meeting where the official cash rate is expected to remain at 1.5%.

Australian monetary policy is currently stuck between underlying inflation, which is below target,  and accelerating house prices.

The market may move on comments about the Aussie Dollar or the banks recent out-of-cycle rate rises, and that APRA has again slightly tightened the terms on investor lending.

As such, real estate names will be in focus after the announcement.

Chart – YANK
Chart – MVA (Aust Property ETF)

ETF Update: Buy The YANK

The USD Index had its strongest week in over two months as better-than-expected GDP numbers, combined with hawkish comments from FED officials, lifted the Greenback against all the major currency pairs.

The bulk of the gains were against the EURO and YEN, with the AUD/USD finishing the week pretty much unchanged.

We don’t expect this to last. With the RBA overnight interest rate policy firmly on hold, the divergence of interest rate policy trajectory between the USA and Australia will push the AUD/USD lower.

Technically, the AUD/USD closed the week below the 30-day moving average with the RSI momentum indicators pointing lower. We see the first key support level at .7580 and have a medium-term target near the January low of .7160.

Investors who want to profit from the a lower AUD/USD can look to buy the BetaShare YANK ETF. YANK is an inverse ETF with a 2.5% weighting. This means that the share price of YANK will increase by 2.5% for every 1% fall in the AUD/USD.

With the YANK currently priced around $14.20, we estimate the share price to rise to $16.40 when the AUD/USD reaches .7160.

Call in for more information about YANK and the other ASX listed ETFs


Chart – YANK ETF

Telstra & TPG Telecom

Over recent weeks we’ve watched money flow into defensive yield names such as Sydney Airports, Transurban & GPT to name a few. Telstra has somewhat been left behind and we therefore may see buying support build from the current oversold levels.

We’ve focused on the short-term chart patterns in both TLS and TPM as a point of interest. Also, we’ve included a chart of the iShares Global Telco ETF to help capture the “bigger picture” trend within the large cap global Telco companies overall share price performance.

Chart – TLS
Chart – TPM
Chart – iShares Global Telco ETF


Buy The Dip in Gold

After a sharp rally on the back of equity weakness last week, Gold has consolidated above the $1240.00 level.

The technical picture is still constructive as the yellow metal is still above the 30-day moving average  at $1234.00 and the RSI reading at just above 56.00.

There are still many global stock indexes trading at elevated prices. The market has proven that the inverse correlation of Gold moving higher, as stocks move lower, still intact.

We see scope for a test of the $1235.00 level before trading higher next week. Our medium-term target is the November 10th high of $1292.00.

Investors looking to profit on a move higher can look at either the Vectors Gold Miners ETF (GDX), buying the dip in Newcrest Mining down to $22.00, or placing Newcrest Call Option strategies.

Chart – GDX
Chart – NCM