Bad News For Aussie Banks
Australian banking names received a double-dose of bad news last night as the Parliament passed the $6.2 billion banking levy and Moody’s downgraded their long-term credit ratings citing risks associated with the local housing market.
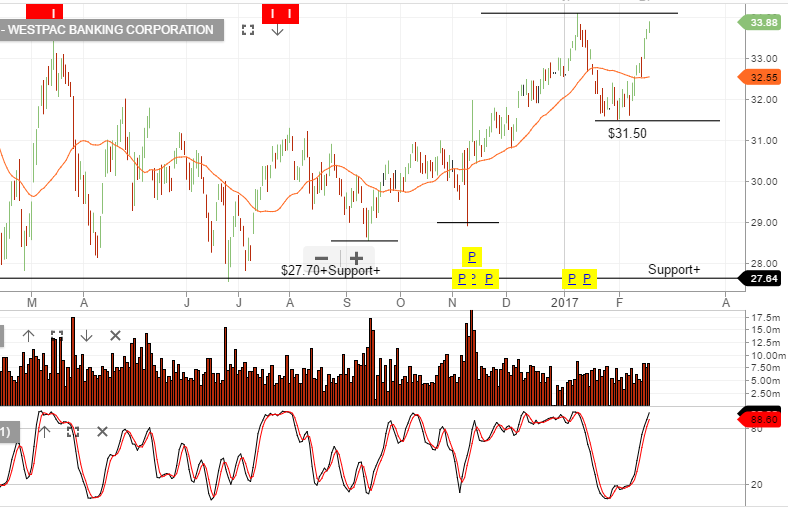
Shares in all the major banks have opened lower today with Westpac half-a-percent lower. The banking stocks have posted a rebound over the last few sessions but now look poised to re-test the lower price levels seen in early June.
Our ongoing concern about the banking sector’s current valuations have been: limited growth in the loan generation area, as well as, deteriorating quality of their overall loan exposures.
The banking levy, which commences July 1st, and the prospects of higher funding costs due to the credit downgrade won’t improve the banking sector’s profitability over the longer-term.
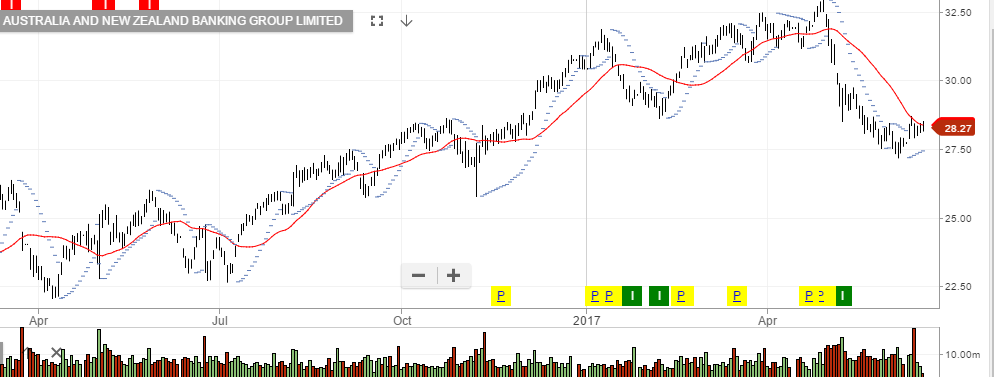
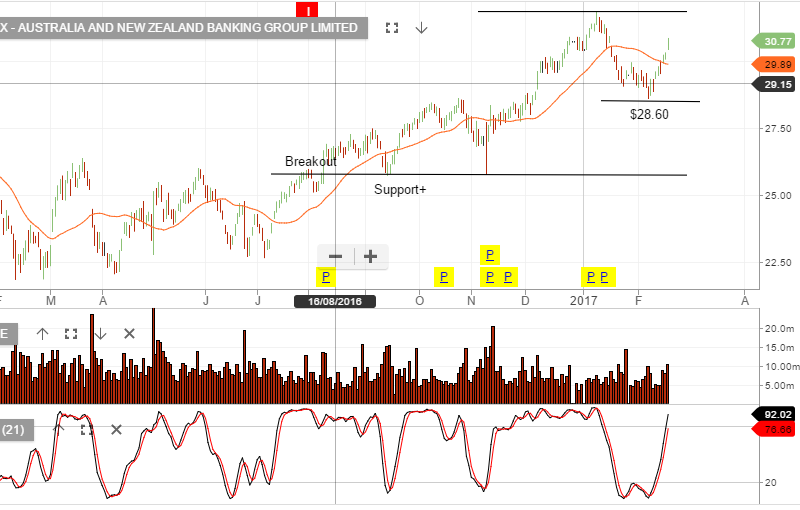
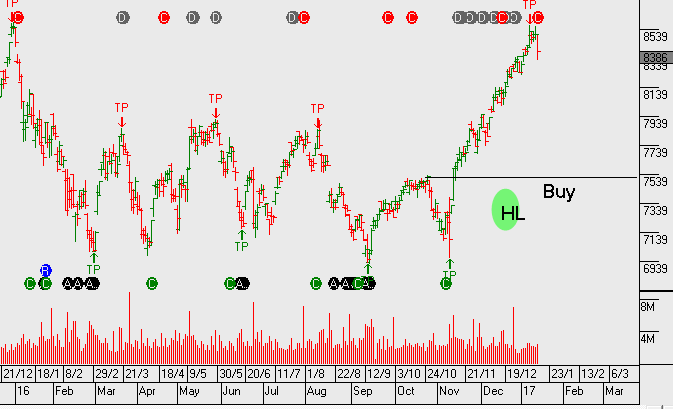
ANZ
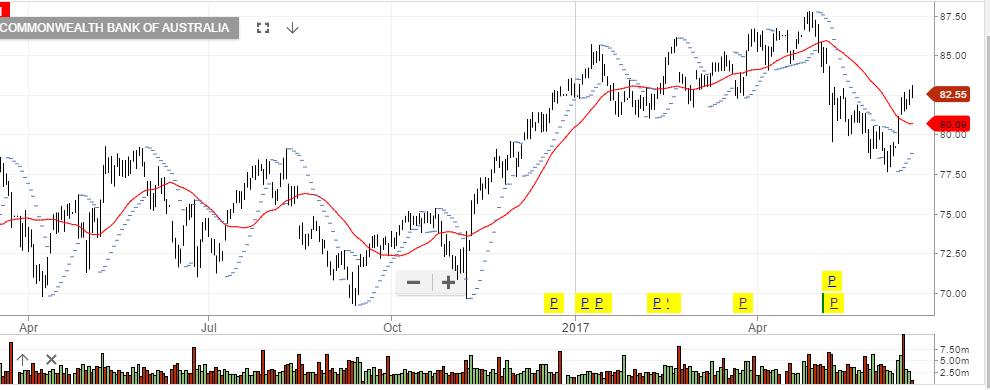
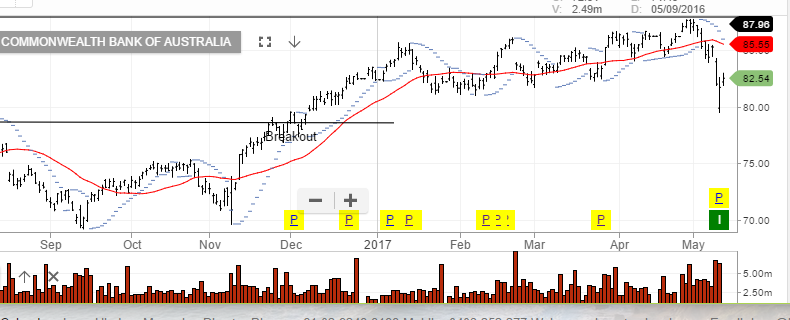
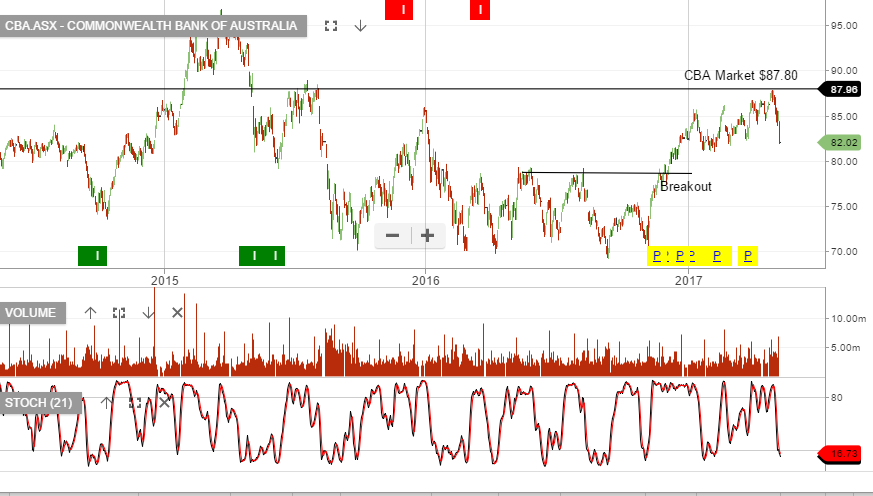
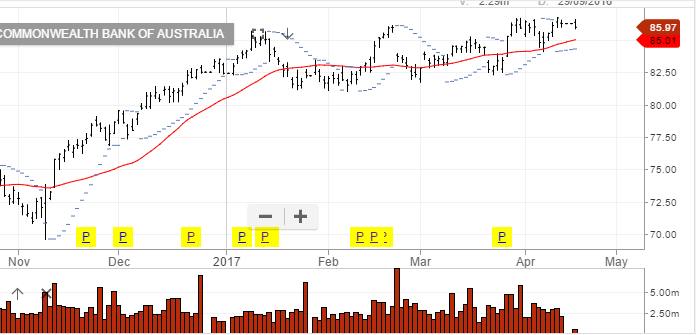
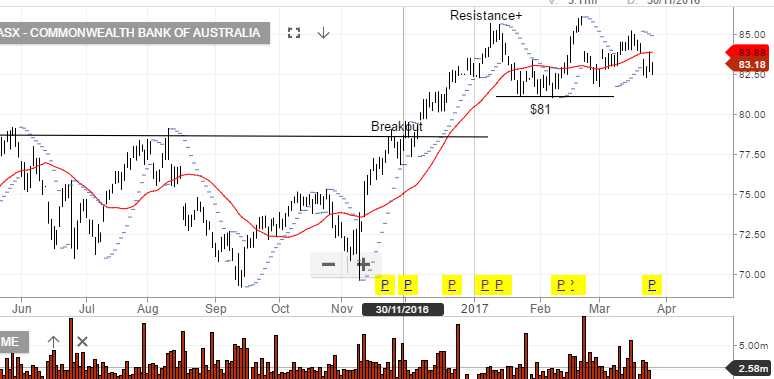
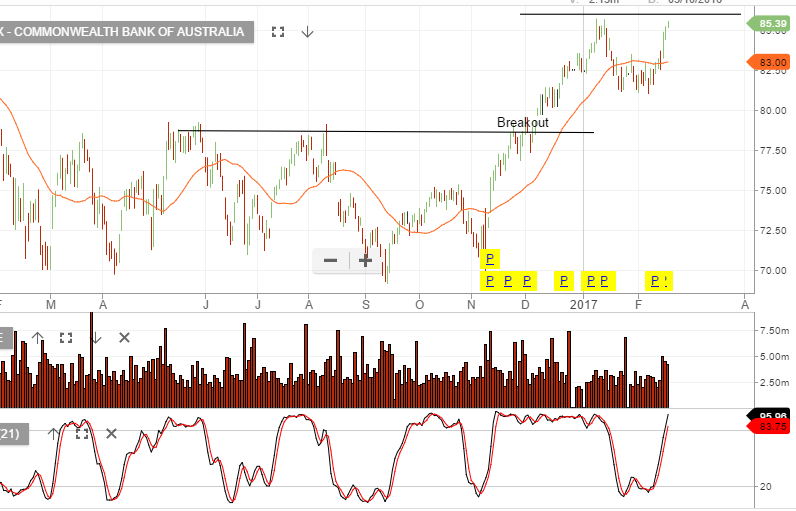
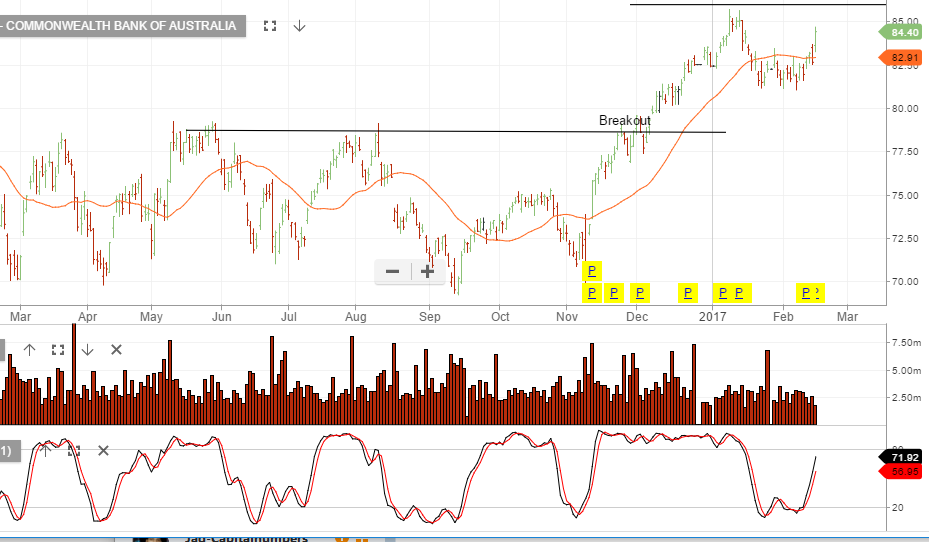
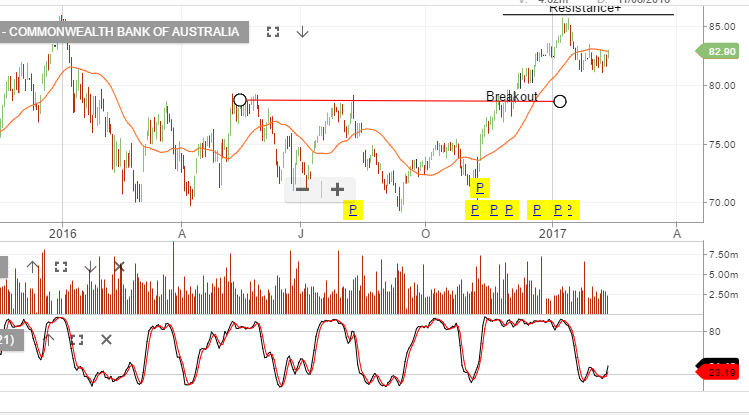
CBA
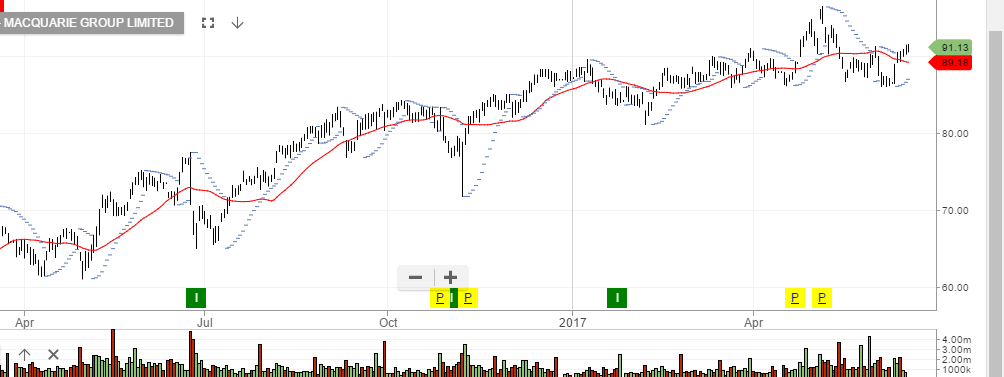
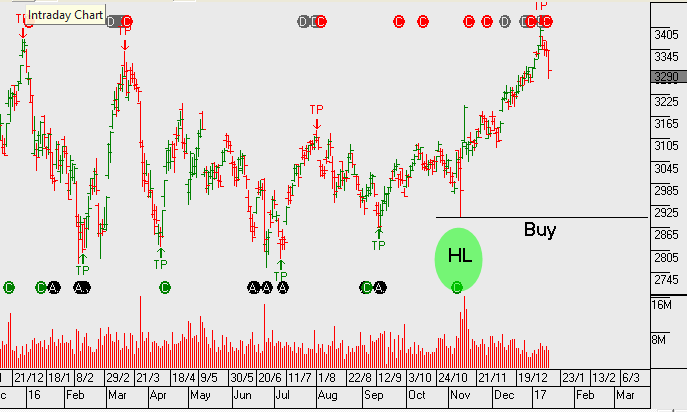
MQG
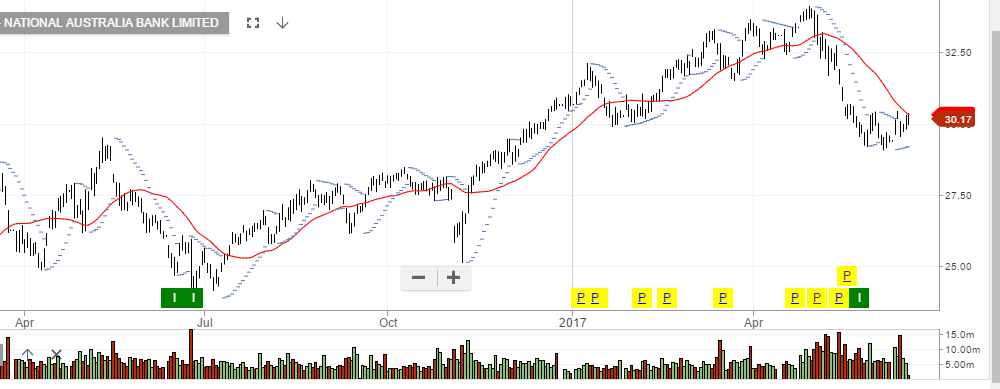
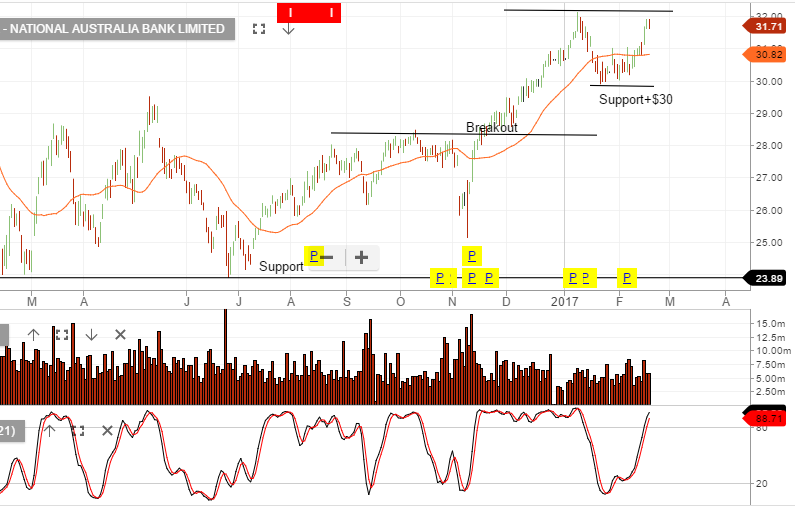
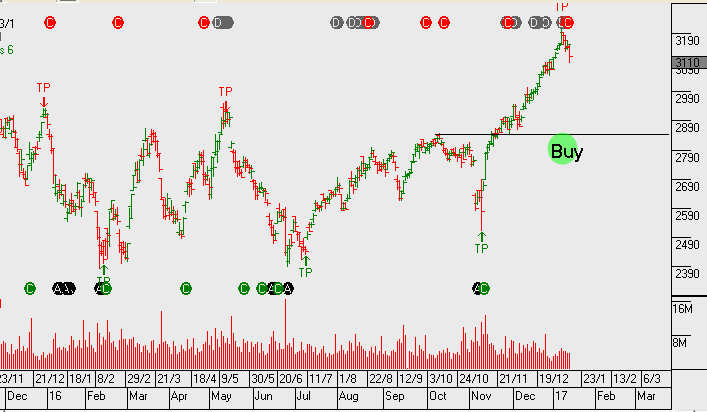
NAB
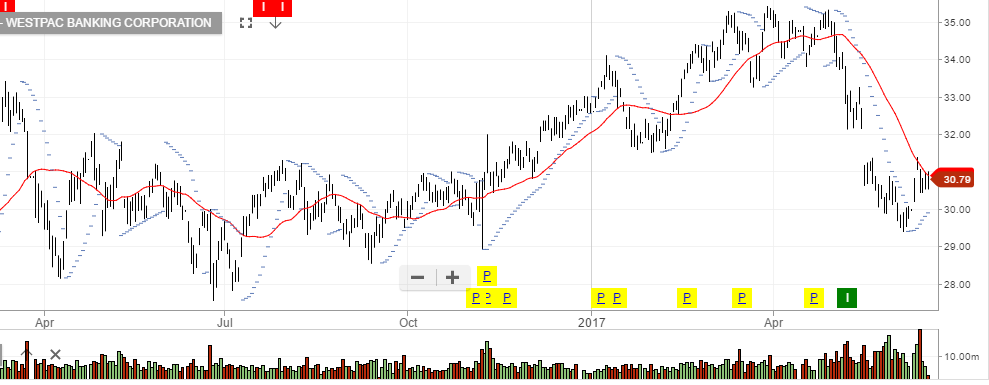
WBC