Currently, ASX leading Financials are being dragged higher as the US equity rally continues into the lead up to their fourth quarter earnings results. We’re somewhat sceptical of the valuation support and yesterday started hedging our banking exposure in client portfolios. This was done through using in-the-money European-style calls over CBA and slightly in the money February calls over NAB, as two examples.
In the case of CBA, we stay exposed to the February dividend and franking credit but have hedged a price pullback of up to 5% between now and March.
In NAB, we’ve hedged to a similar extend but without the need to protect the dividend. NAB’s next payment period is not until May
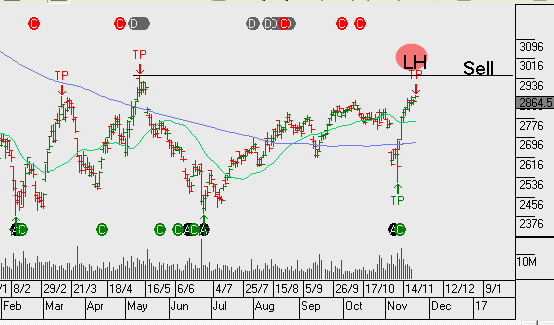
Shares of the Commonwealth Bank (CBA) posted a new high for the year at $82.65 as the bank announced it has sold its remaining stake in the US financial services company, Visa Inc.
The CBA sold its stake in Visa for A$439 million, realizing a post-tax profit of A$278 million. Against this profit, CBA has also announced a one-off accelerated amortization on certain capitalized software assets, totalling A$275 million.
While the accelerated amortization is more than offset by the profit on the sale of the bank’s Visa holdings, we see this move as reducing the potential for earnings uplift going into 2017. As such, heading into the February dividend, we see price resistance at or near the $83.00 level.
Australian consumers borrowed less in the month of October with RBA data showing private credit growth at 0.5% (5.3% year on year) versus a YoY rate of 5.4% last month. A closer look at the data suggests Australians are interested in buying real estate and not much else. Even though housing credit growth was flat last month at 6.4%, the pace is still well above the 4.4% growth in Business credit and the rate of Personal credit; which actually dropped to -1.1% Year on year. It’s likely that the growth in housing credit has been supported by the RBA’s rate cuts in May and August. However, the RBA won’t miss the fact that lending over the last 12 months has a flat to lower trajectory, which may influence their policy directives going forward.
Australian banks continue to push up against the top end of the their price channels. We’re mindful of the rally in US banks helping to boost investor sentiment towards the sector, yet there is limited evidence domestically of any pickup in earnings on the horizon.
There is a saying in the financial markets that a “rising tide floats all boats” This old adage has been used recently to describe how the rally in US bank shares has lifted the share prices of Australian banks.
Since November 4th, shares of Citibank have gained 14%, shares of JP Morgan have gained 16%, shares of Bank of America have risen by 17% and Goldman Sachs shares have rallied by over 20%.
Over the same period of time, shares of ANZ have gained 6%, shares of Westpac have gained 8%, CBA shares have lifted by 8.5% and shares of the NAB have rallied by 11%.
Interest rates in the US began bottoming out in late September, which was positive news for most US financial names. In addition, the election of Donald Trump is being hailed as a “game changer” for the U.S. banking sector, as the Republican sweep of the White House and both houses of Congress appears to have shifted investor’s expectations about interest rates, regulation and the broader business environment.
With respect to the Australian banking names, these two key points aren’t applicable.
The RBA may have moved to a neutral bias on domestic interest rates, but there’s no realistic expectations for a rate hike anytime in the foreseeable future. And, if any regulatory changes are legislated in the Australian banking industry over the next 12 months, they are more likely to be restrictive, as opposed to accommodative.
With this in mind, we will use this recent rally in Australian banking names to implement our derivative overlay strategy and sell covered call options to enhance returns on bank share holdings.
Stay tuned to the Investor Signals daily blog for specific timing and price information.
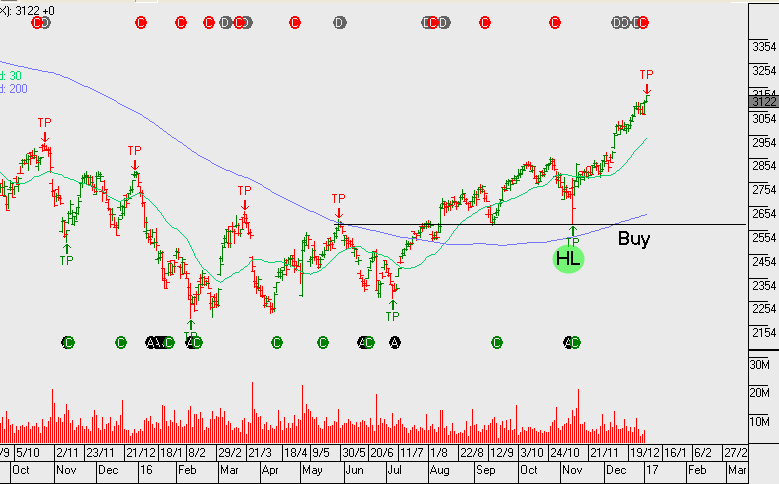
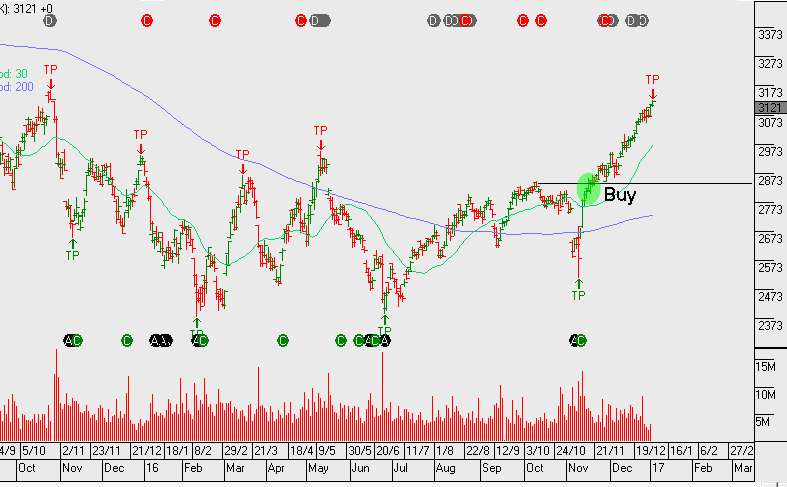
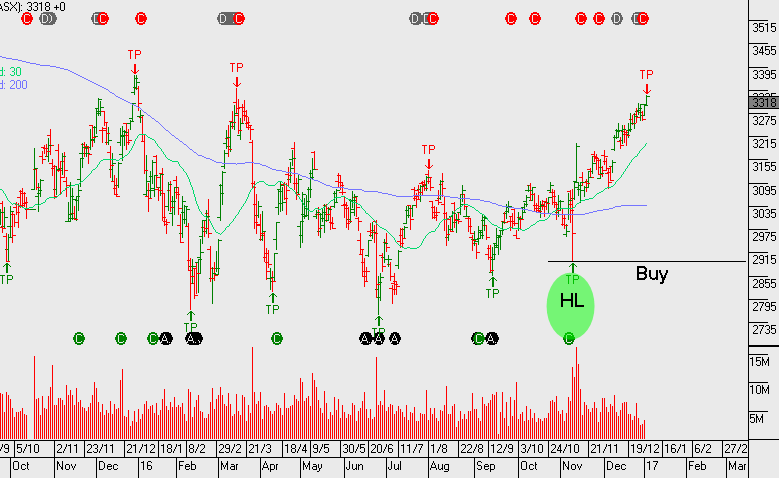
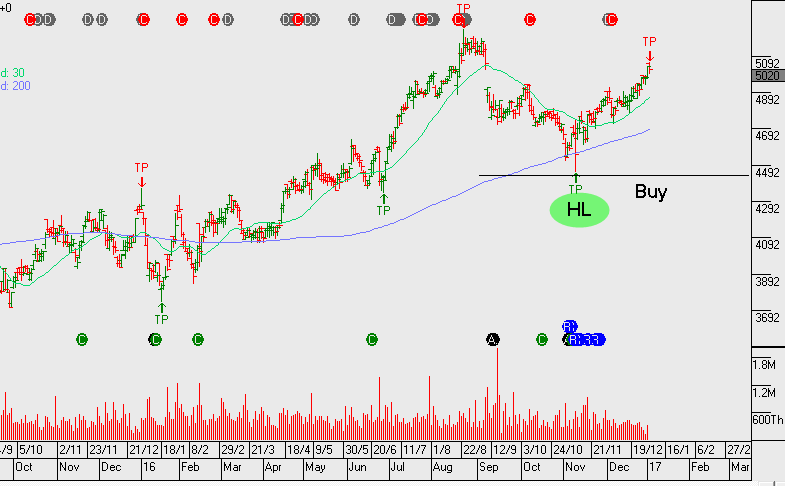
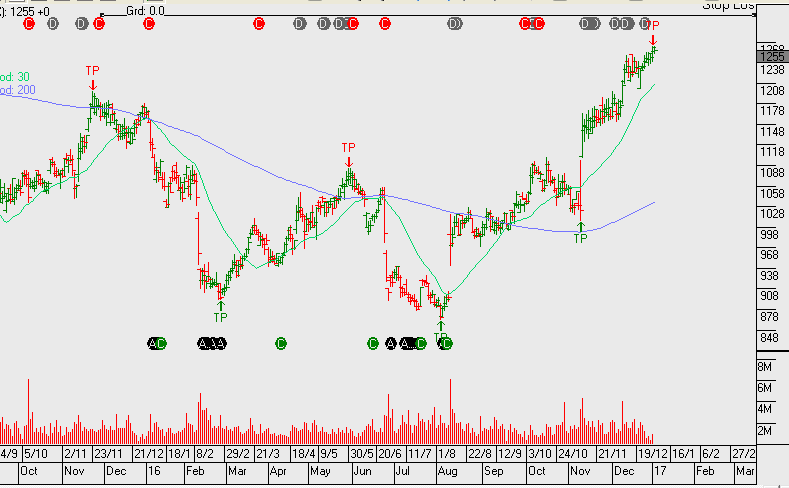
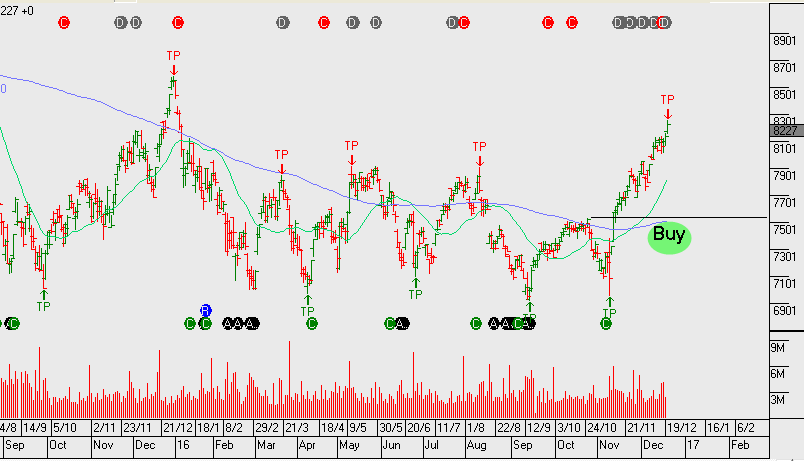
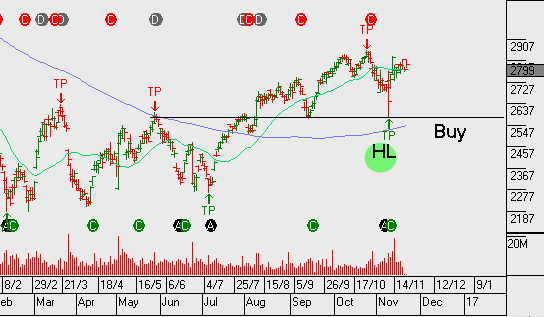
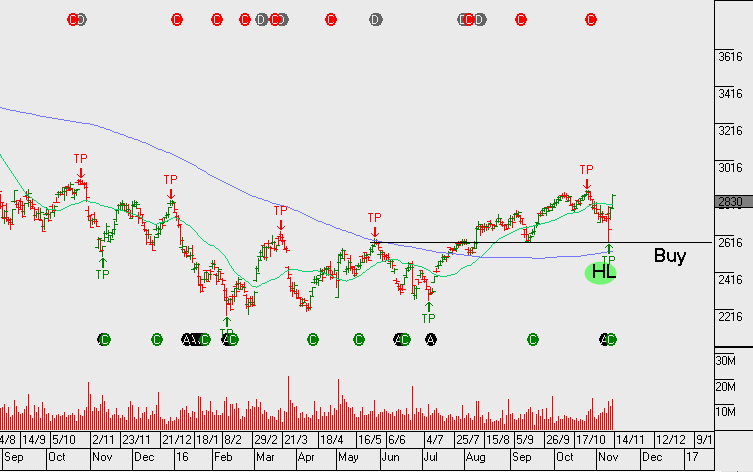
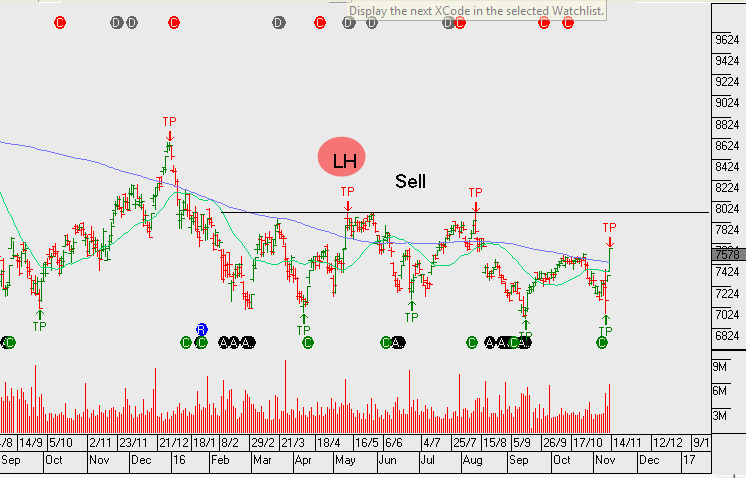
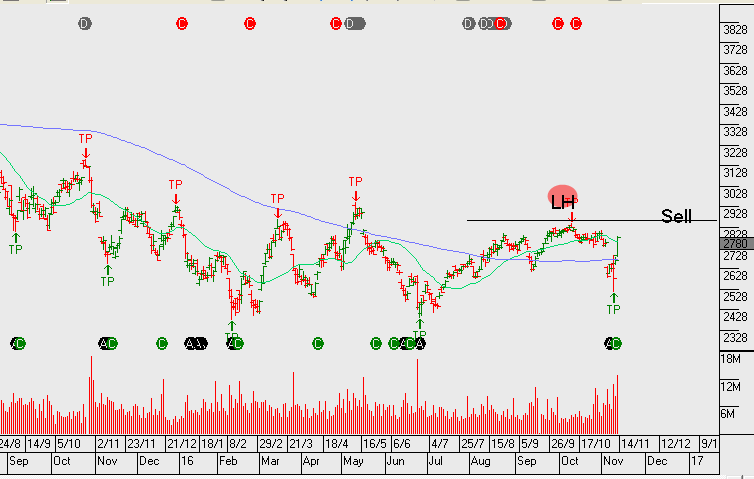
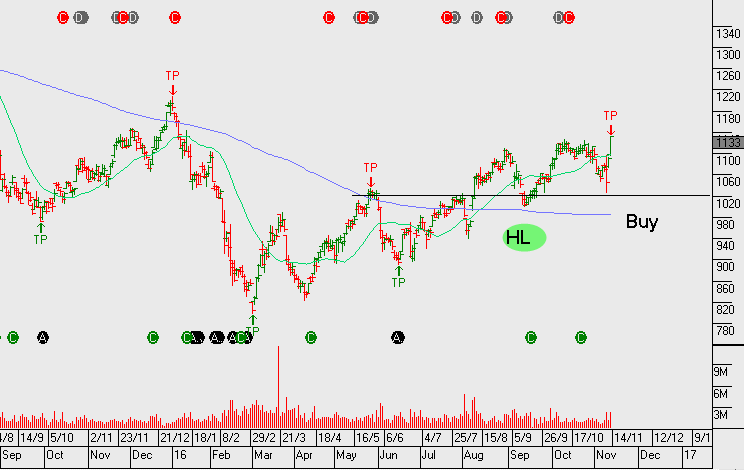
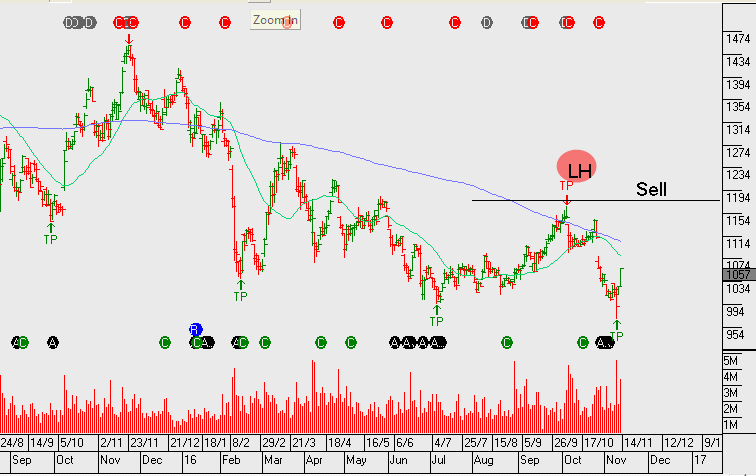
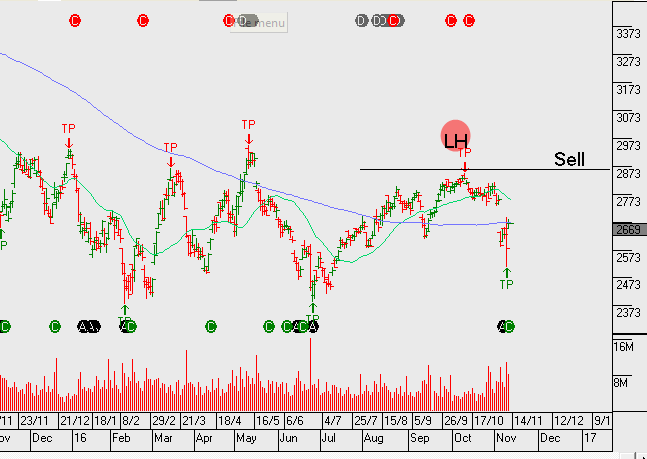
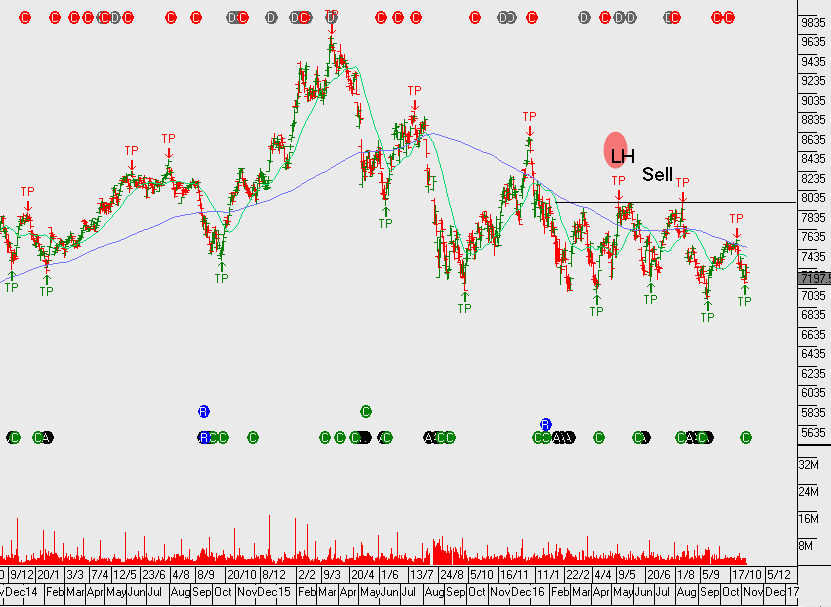
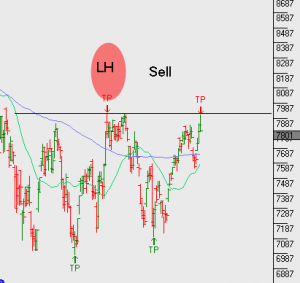
We now have ANZ and WBC creating a higher low formation. However, CBA and NAB still remain below the recent highs within the downtrend that’s been in place since May 2015.
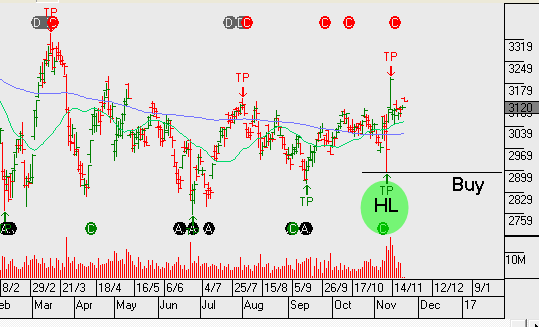
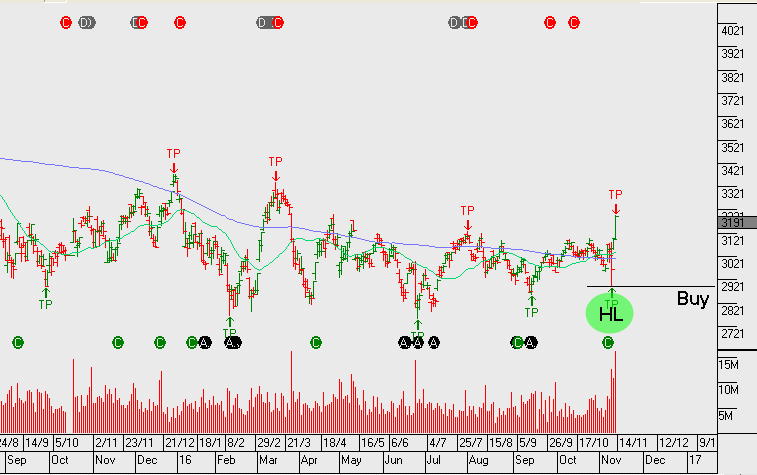
Back in August, ANZ was the first to break the downtrend and now WBC has followed. Within the regional banks, between BOQ and BEN, it’s Bendigo that’s displaying a more bullish price pattern.
Although the breakout in financials is strong at present, we don’t see too much further upside. As reflected in the recent earnings results, the banks are having difficulties growing top line revenue. Our largest bank exposure in client portfolios is Westpac. We’ve left this name uncovered at present, however, it’s likely we’ll identify a point this week to add covered calls to enhance the yield.
ANZ goes ex-dividend $0.80 on Monday & WBC also goes ex-dividend $1.00 on Monday.
National Australia Bank delivered 2H16 earnings which showed strong organic capital generation and underlying earnings trends that were relatively strong compared to their banking peers. In addition, it’s also worth noting that the SME business segment is showing early signs of a pickup in credit growth; this is an area where NAB has traditionally led its competitors.
NAB trades on almost a 10% discount to its peers and we may begin to see scope for this discount gap to close.
Consistent across all the major banks, we continue to see mortgage margins under pressure. This remains a concern, especially for Westpac and CBA as they’re likely be impacted the greatest by declining mortgage margins.
NAB FY17 underlying profit is expected to be $10b on EPS of $2.30 and DPS of $1.70 placing the stock on a forward yield of 6.5%.
Financials globally are getting a boost following the US election, however, we remain cautious and look to sell call options into the rally.
CBA reported 1Q17 earnings of $2.4 billion, which was largely in line with market expectations. On pre-provision basis the result was marginally below consensus.
CBA’s result was supported by an improvement trading income and lower impairment expense. Revenue growth trends continued to slow with growth falling from 5% in FY16 to 3% in FY17.
FY17 outlook is for EPS of $5.40 and DPS of $4.20 placing the stock on a forward yield of 5.8%
CBA remains in a structural downtrend and like all bank holdings should be complemented with covered call options to enhance the risk reward scenario. Additionally, investors need to be cautious about being overweight banks as other more attractive opportunities exist within the group of ASX top 50 stocks. These companies also offer high yield plus franking credits supported by solid EPS growth.
CBA.ASX delivered NPAT of $9.45b an increase of 3% on the same time last year. Fully franked final dividend of $2.22 per share.
Fy17 EPS growth outlook for 3% placing CBA on an FY17 forward yield of 5.5%.
Best risk reward strategy from here with CBA is to sell European calls at the $75.71 level into Sept for a $2.10 credit, which will keep exposure to the Aug dividend and deliver $4.32 of cash flow from each CBA share, whilst providing some downside protection. For help on this one, please email me leon@investorsignals.com
Sophisticated Investor?
We have special opportunities available for Sophisticated Investors. If you're interested, and qualify, please provide your details below.