November – ASX Top 50 Video Market Update

The great consolidation – we had a 50% drop in Australian equity prices from Jan 2008 to March 2009.Over the last 7 years, the bulk of the bull market recovery in Australian equities occurred during 2010 to 2014. Since that time, the ASX 200 has mainly traded sideways. Within this sideways price action, we’ve experienced the banks and resources under-perform from May 2015, (although resources have rebounded in the past few months), whilst infrastructure, property trusts and industrials outperformed.

During the past few months, the driver of equity prices has been the fear of rising US bond yields and, as a consequence, it’s driven a rotation out of defensive assets and into growth names. Albeit, domestically we think it’s been a net selling position by off shore money managers, rather than a rotation into domestic growth names, large US listed companies are where global money managers are allocating towards growth.

As a result of this dynamic, yield names will bounce from here but not make new highs, resources will move a little higher but run out of steam by the first quarter of the new year, industrials are trading on relatively high PE and Australian banking shares offer little or no growth at a revenue or underlying profit level.

So, what does this mean for your average Australian share portfolio? I believe the message is: get ready for the great consolidation. Equities will mostly move sideways and selective asset allocation based on technical and fundamental support levels, combined with a derivative overlay, is the most compelling risk reward way to beat the market. Dividends, franking credits and call option income should lead to a much better bottom line in FY17 than the 4% average return of industry super funds in FY16.

Most portfolios that carried overweight positions in banks and Telstra delivered negative returns in FY16. A passive buy and hold strategy is not enough. Unless an investor is taking advantage of covered call options and trading opportunities around the fringe of their portfolio, I fear that FY17 could be another year of under-performance for the retail investor.

Please take the time to watch the latest video market update report to understand more about the strategies Investor Signals is implementing in the current market.
Boral 1Q17 Trading Update

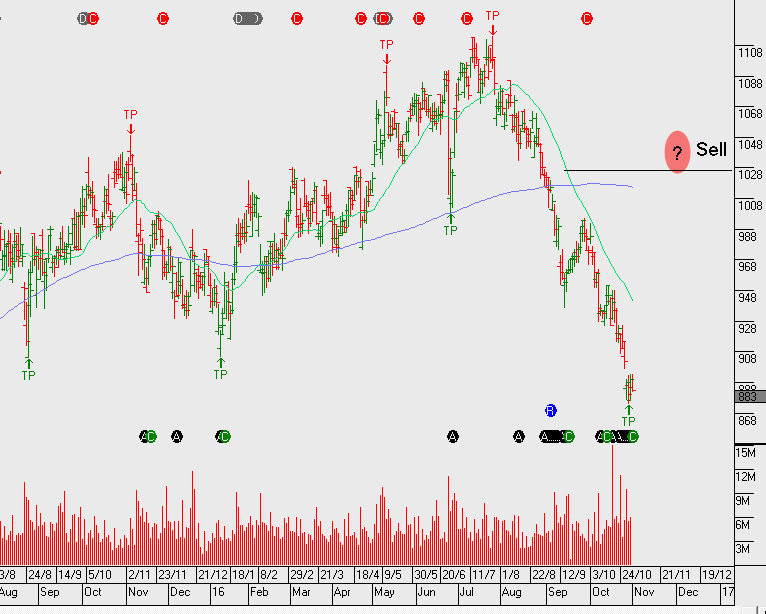
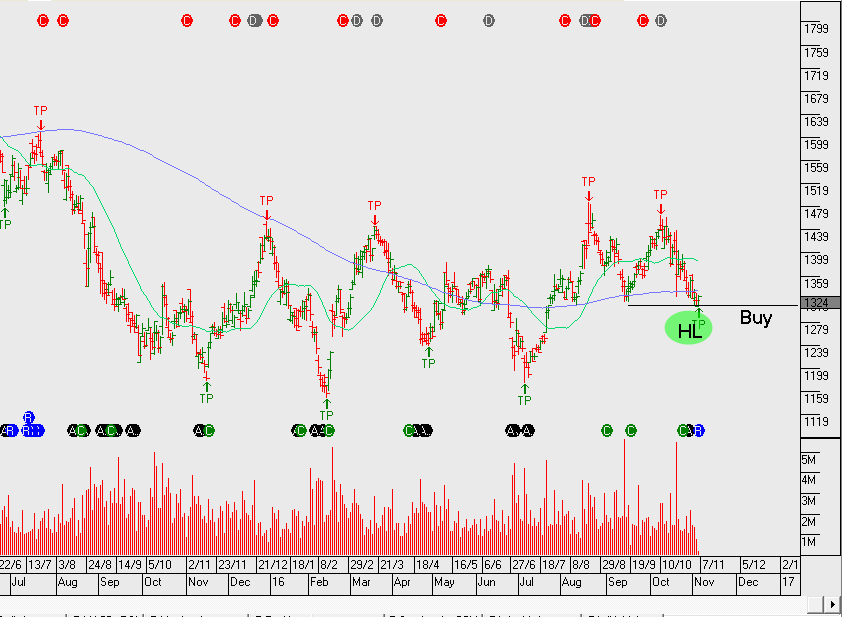
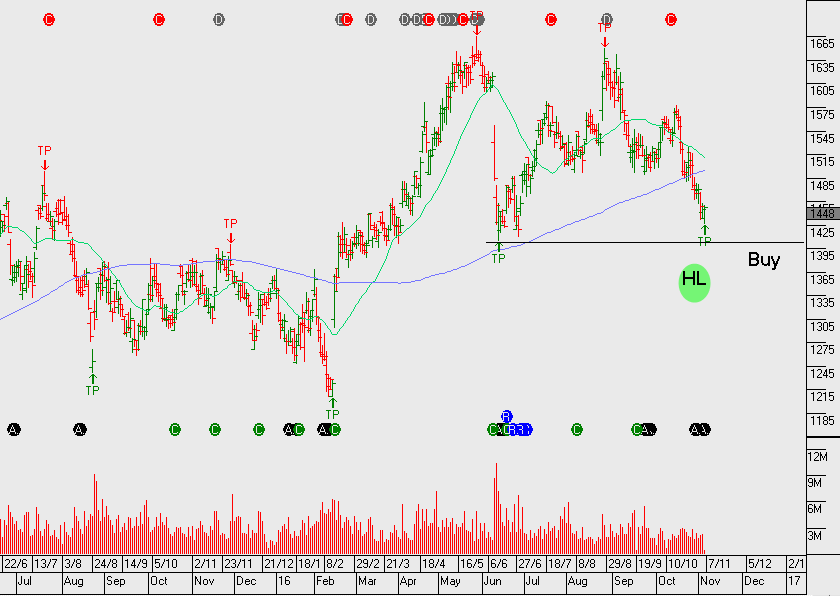
The Boral AGM provided an update on 1QFY17 earnings due to weather impacts and a slowdown in WA, FY17 earnings are now tracking below market expectations.

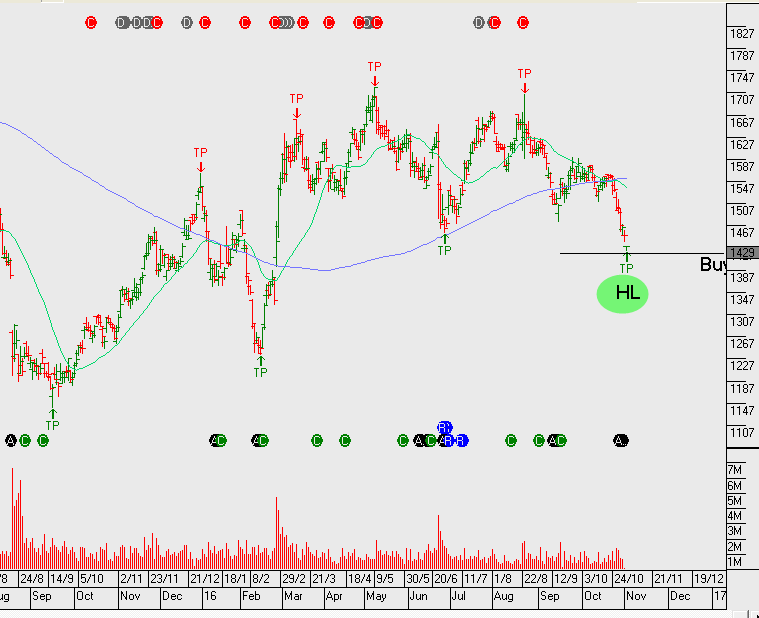
We continue to like BLD and JHX as exposure to improving infrastructure markets in Australia and ongoing positive trends within US housing. The sell-off in BLD is probably overdone and it’s worth adding this to your watch list. $5.50 as a potential buy level on any further weakness should be monitored as an entry point.

Y18 revenue growth 5% to $4.2b, EBIT growth into FY18 of 8% or $450m, EPS of $0.40 and DPS of $0.25 places the stock on an FY18 yield of 4.5%

bld
Chart – Boral


Buy Signal on Ansell

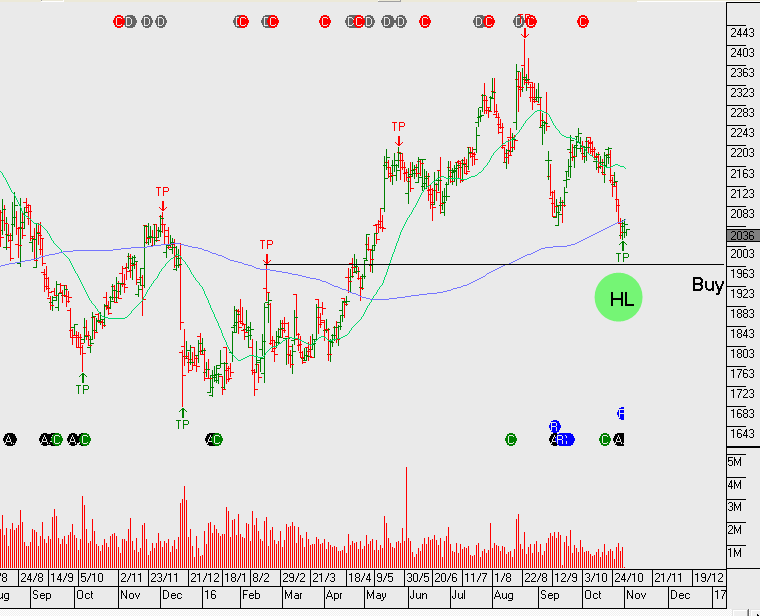
The algorithm engine is flagging ANN.ASX as a buy at $21.00. With the pending spin-off (or break up) of divisions within Ansell, added share holder value will be unlocked. Stable earnings, yield support along with the corporate restructure means the fundamentals will support the technical picture.

PE 15x the FY16 EPS or $1.40, DPS $0.60 placing the stock on a yield of 3%.

Buy in the range of $20 – $21 and hold for bounce to $22 and then sell $23 calls on the other side of the Feb dividend.

ann
Chart – Ansell


ANZ – FY16 Earnings Result

ANZ Bank announced an 18% fall in FY16 profits to $5.9 billion, which included the $360 million one-off charge reported last week. In response, the bank is considering selling off key parts of its wealth management and insurance divisions.

In releasing its full-year earnings, the lender said it will pay a final dividend of 80 cents per share, inline with what it paid in the first half of 2016. The dividend will be fully-franked and paid on December 16th. This will take the bank’s dividend payout ratio to 67% after removing the one-off charges.

The return on equity now stands at 12.2% down from 13.8% during the same period last year and represents the lowest of the big four banks. The bank’s tier one capital ratio, the size of its capital buffer in relation to its assets, stands at 9.6% which is in line with the year ago percentage.

The current earnings report includes a total provisions charge of $1.95 billion, equal to a loss rate of .34% of outstanding loans. The bank said charges for bad loans had risen during the year due “pocket of weakness” in the economy, especially in the mining and resource sectors.

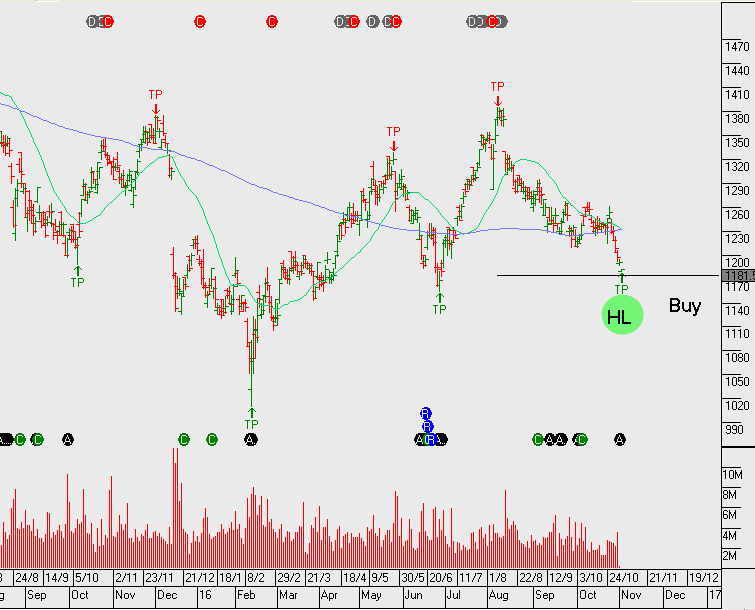
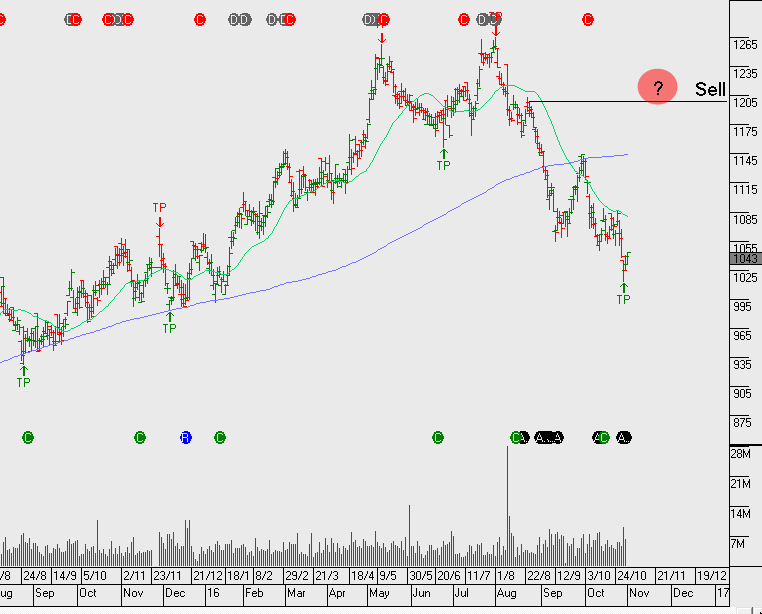
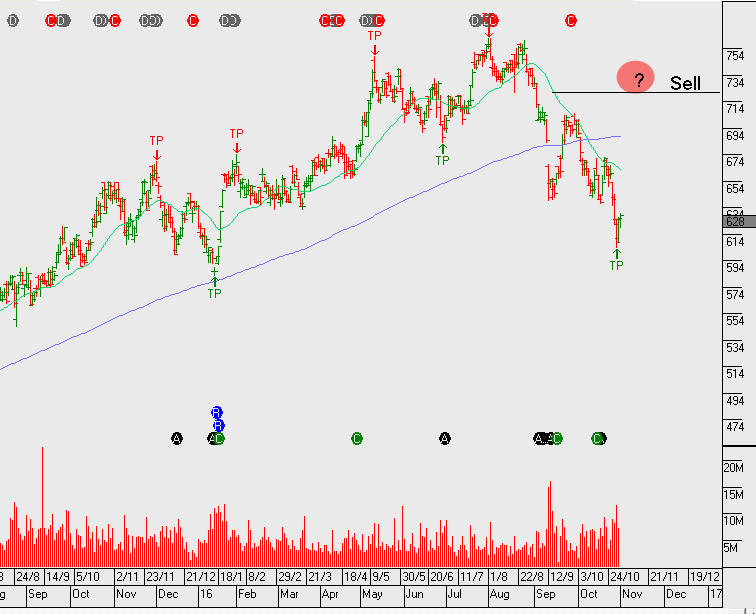
We’re watching ANZ as a buy on the dip, it’s the only one of the four majors that has a breakout or bullish higher high structure. We now wait for the pullback and the algorithm engine will soon flag the buy on the dip set up. The chart below illustrates where we think the signal is most likely to occur.

anz
Chart – ANZ


US Earnings – Alibaba

Alibaba beat expectations in its latest report by posting adjusted earnings of 79 cents per share on $5.12 billion in revenue. Analysts were expecting 69 cents per share and $5.03 billion in revenue. In last year’s September quarter, the online retailer posted $3.28 billion in revenue and adjusted earnings of 53 cents per share.

The company announced core commerce revenue grew 41% to $4.3 billion, while cloud computing revenue increased 130% to $224 million. The adjusted EBITDA margin was 46%, compared to 50% during the same period last year.

Digital media grew by 302% to $541 million. The company also announced they had 450 million active users in September, marking a 23 million increase from June.

Shares of Alibaba rose in early NY trading, climbing as high as 104.75 before drifting back to 98.50 at the close. The share price has almost doubled since the February low of $60.50 and the next key level of support will be found at the August breakout price of $85.00

US Earnings – Facebook

Shares of Facebook are down close to 8% in after-market trading to $117.00 even though the social media giant reported quarterly earnings that beat analysts expectations.

The company announced adjusted earnings of $1.09 per share on revenue of $7.01 billion, up from the comparable year-ago figures of 57 cents per share, adjusted, on $4.5 billion in revenue. Analysts were expecting 97 cents per share on revenue of $6.92 billion.

Advertising revenue was announced at $6.82 billion, above the $6.71 billion consensus estimate. Monthly active users rose to 1.79 billion and signalled the first time more than 1 billion users were active on their phones in a month.

However, share prices fell sharply after CFO David Wehner said the “ad load”, or number of ads on the website, could come down meaningfully after mid-2017 which could impact revenue growth in Q4 2017.

The next support level in the share price will be found at the double bottom price at 108.50 last traded in April and June.

fb
Chart – Facebook


Buy Signals – Now Trading on Support

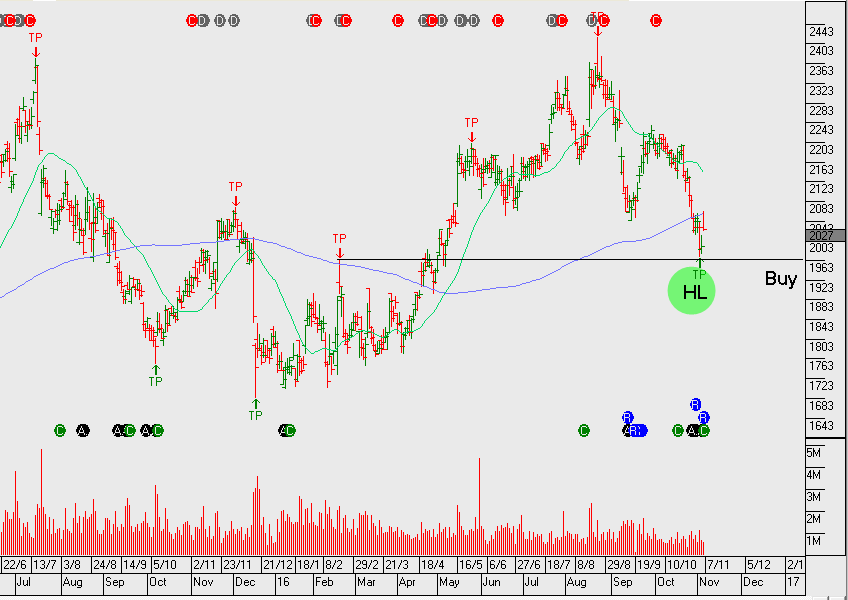
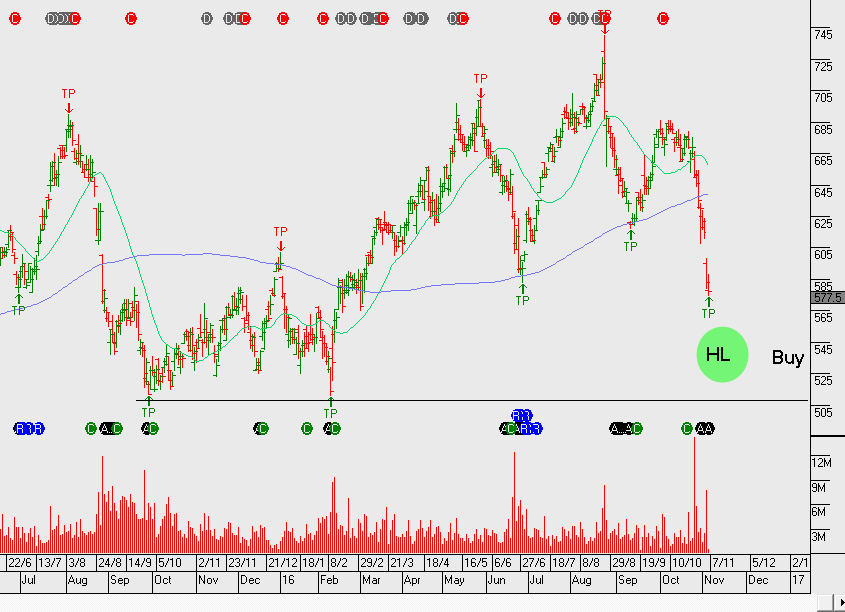
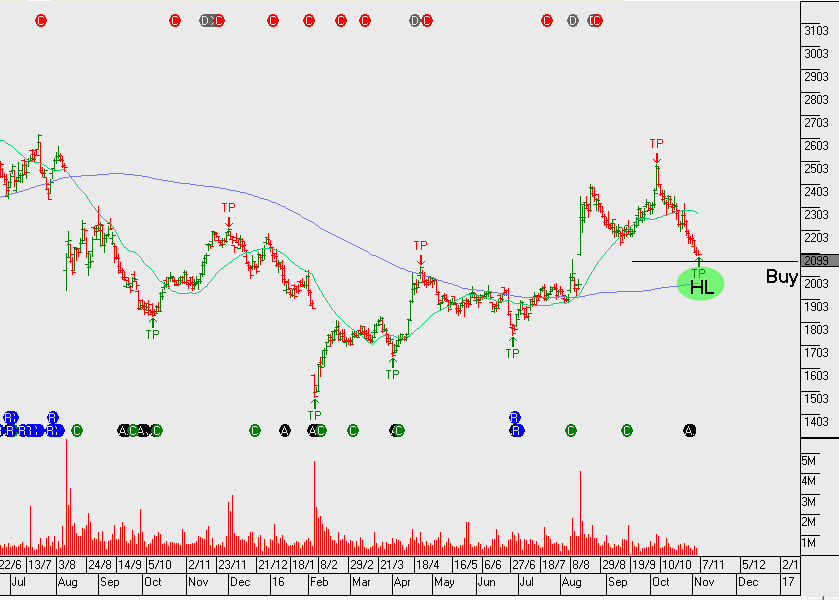
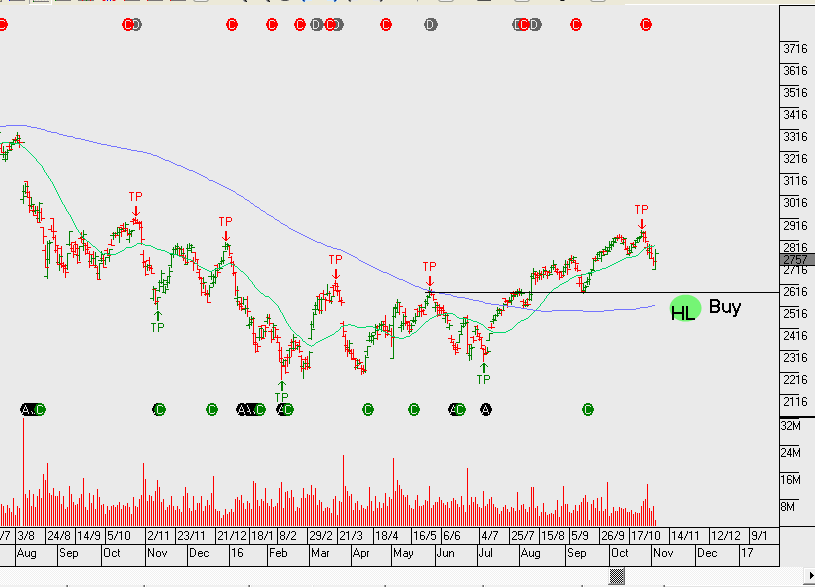
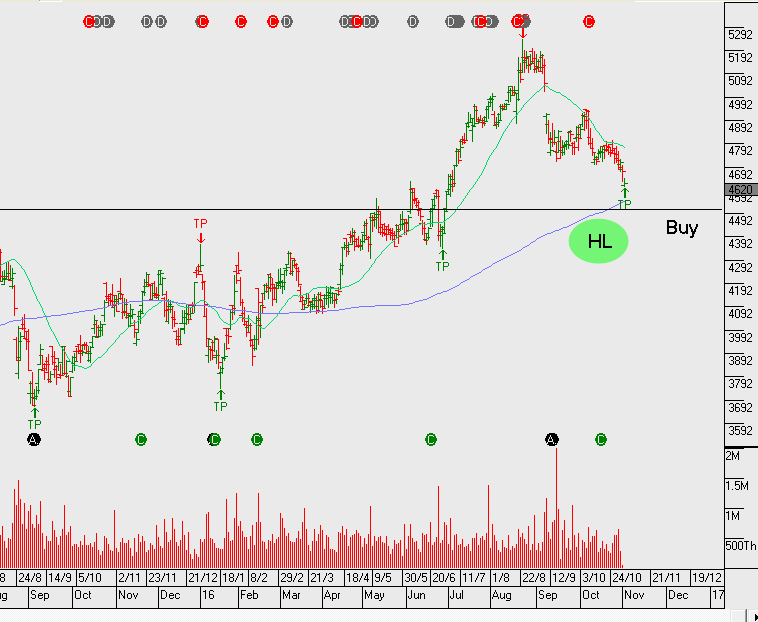
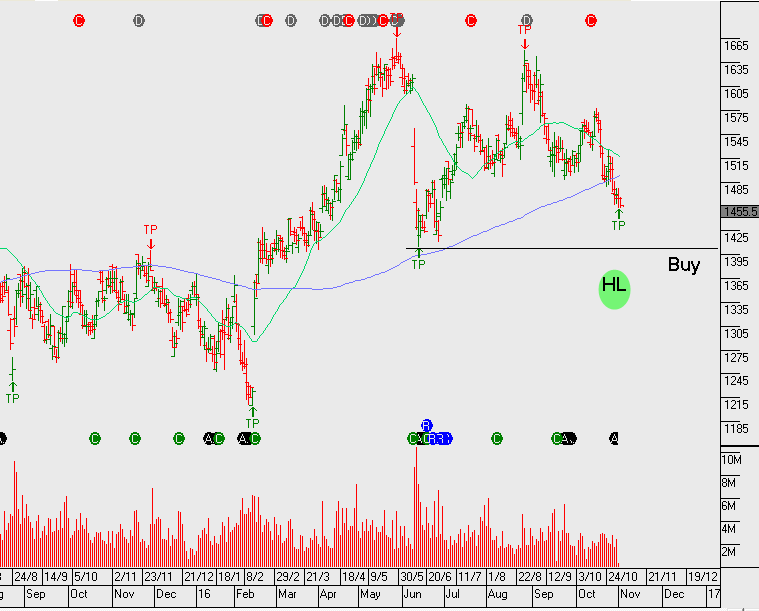
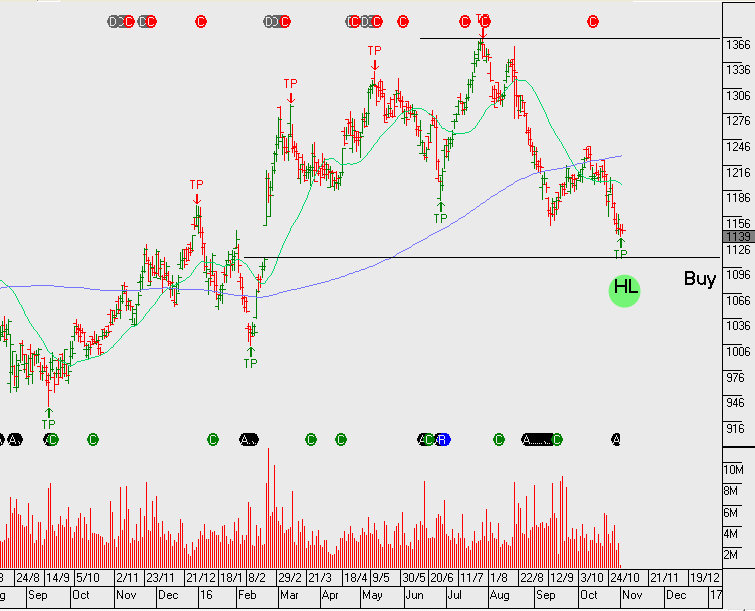
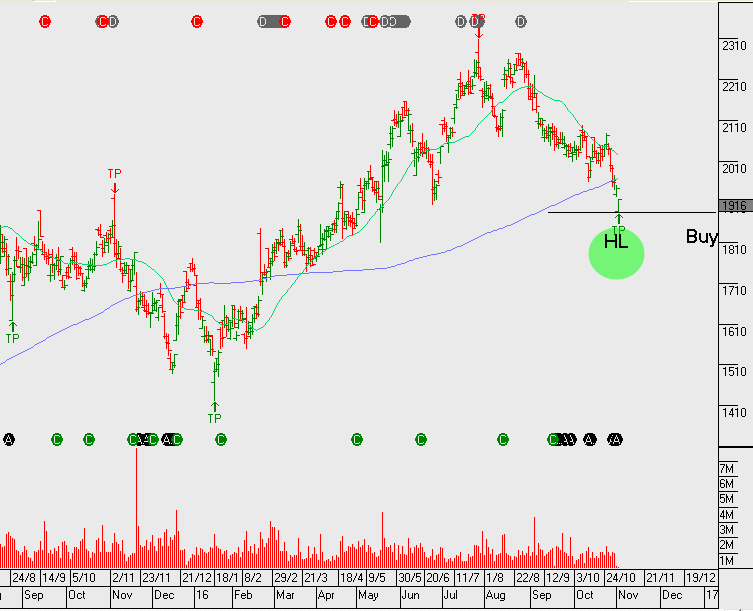
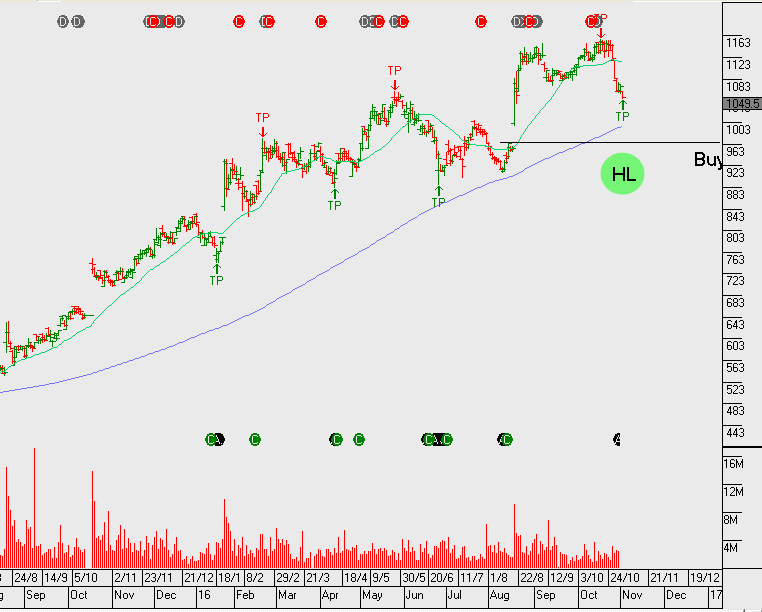
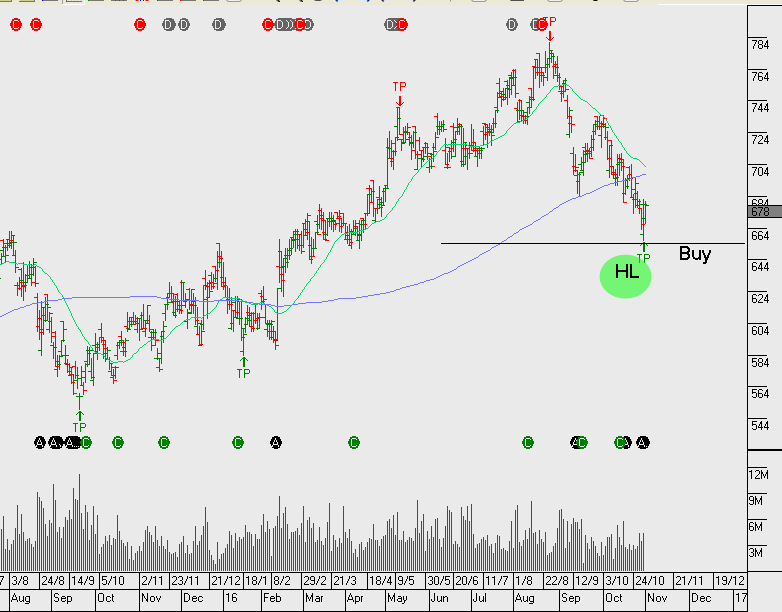
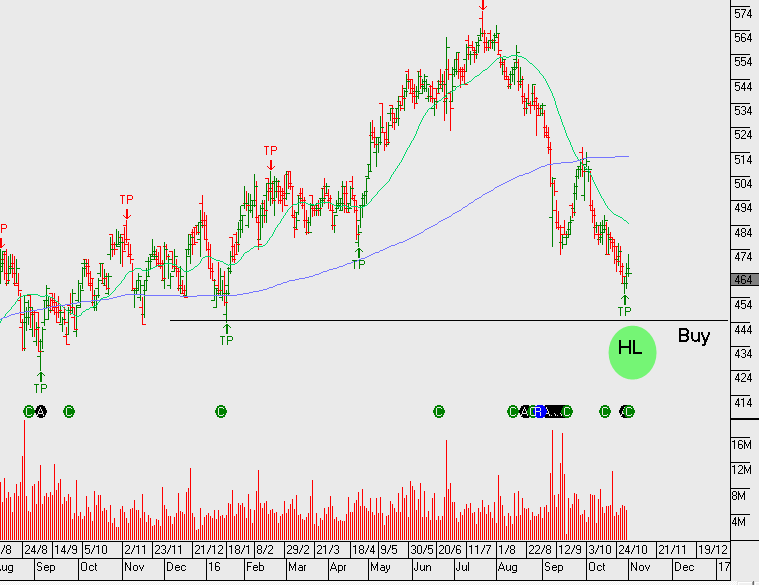
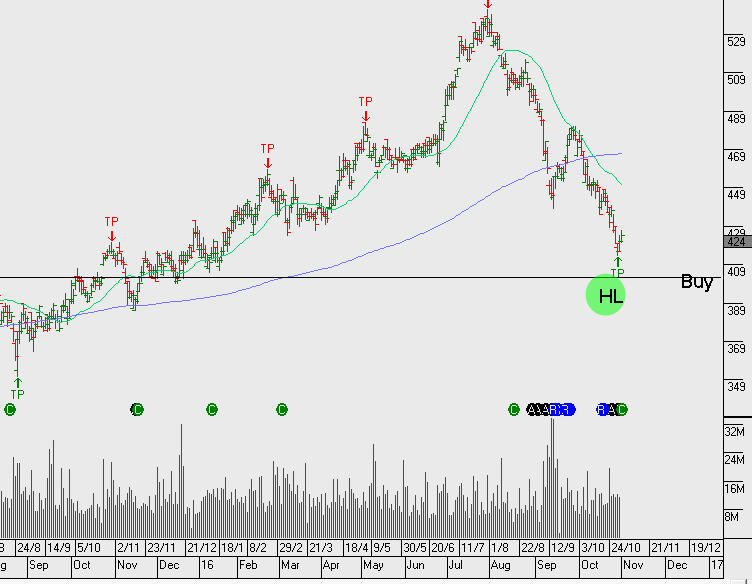
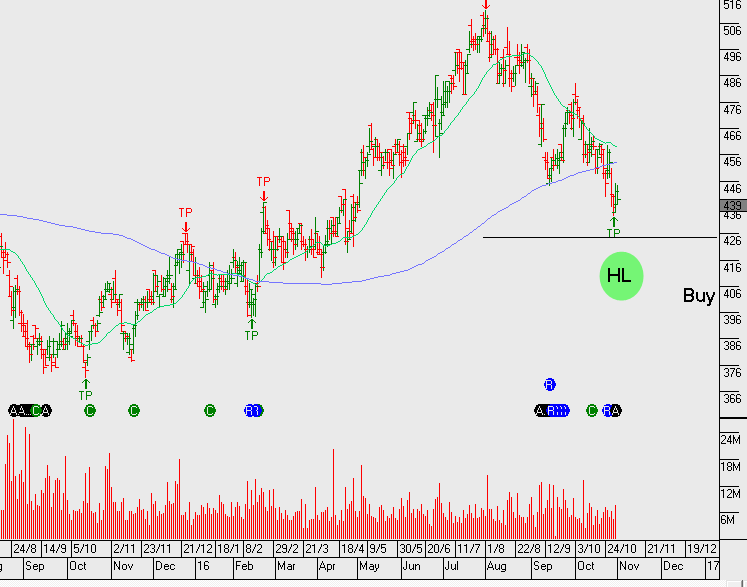
The following group of stocks offer above average earnings growth, structural uptrends and are currently trading back on support levels that warrant closer attention.

ASX, AMC, BXB, JHX RHC, SEK, SHL, SUN and TWE.

asx
Chart – ASX
Chart - AMC
Chart – AMC
bxb
Chart – BXB
jhx
Chart – JHX
sek
Chart – SEK
Chart - SHL
Chart – SHL
Chart - SUN
Chart – SUN
Chart - TWE
Chart – TWE

More detail on the Investor Signals portfolio allocations and derivative overlay strategy will be provided in the October ASX top 50 Video Market Report.


The Yield Basket We’ve Been Tracking

Over the last two months, bond markets have been repricing the probability of a US rate increase. During that time, we’ve watched the US10YR yields trade up from 1.3% to 1.9% . As a consequence, money managers have sold-off defensive yield names. This has been most evident in ASX 50 names within the infrastructure and property sectors.

We maintain a positive interest in these names as the current share prices now have many of the yields offering 100 basis points, (or 1%), more than they were trading at 2 months ago.

WFD and GMG are now trading back on 4% yield, whereas TCL, SYD, GPT and SCG are on average trading near 5% yield.

The December FOMC rate decision meeting will likely be the catalyst for a  bounce, however, we’re not expecting these names to recapture the recent highs. Therefore, we’ll look to sell the rally into the early part of 2017. The algorithm engine will track these names and I’ll be certain to alert you to the next lower structural high, but for the time being, you may want to position around the short term bounce which could offer up to a 10% rally.

Chart - GMG
Chart – GMG
gpt
Chart – GPT
scg
Chart – SCG
sgp
Chart – SGP


wfd
Chart – WFD


Chart - TCL
Chart – TCL
Chart - SYD
Chart – SYD

Wesfarmers – 1Q17 Earnings

Wesfarmers reported notably weaker 1Q17 sales performance which has weighed heavily on the share price. However, excluding UK home improvement and convenience stores, overall sales rose by 3.4% to $12.9 billion.

Overall, FY17 NPAT has been marginally upgraded as positive price developments in their resources divisions offset lower revenue numbers from Target and Coles. Based on Fy17 DPS of $2.30, Wesfarmers is on 5.2% forward yield.

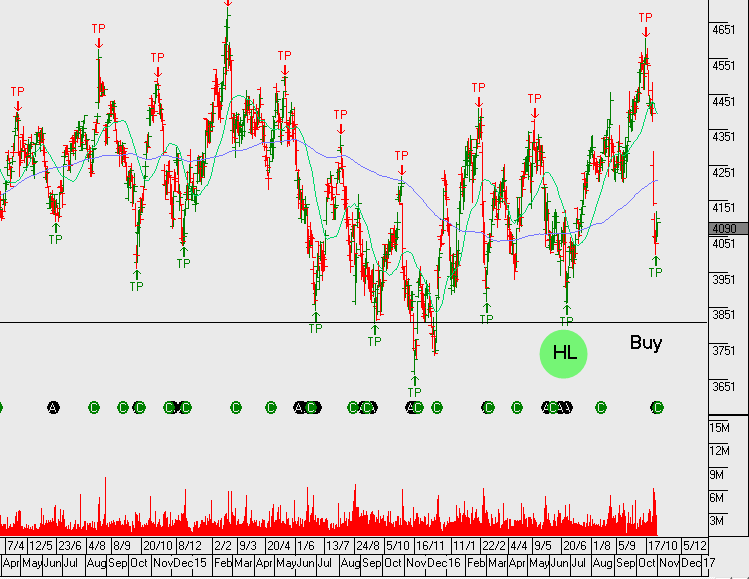
The share price has dropped close to $5.00 over the last four trading sessions and posted a 3 month low of $40.00 last Friday.

We see value emerging again as the stock now trades back at a support level that has been maintained since June 2013. Buy range of $39 – $40 and sell range of $43 – $44. Using covered calls we’re able to boost the cash flow to 10%+ per annum from the dividend, franking credit and call option premium.

wes
Chart – Wesfarmers