Ansell Gets A Boost From The Lower Aussie

Since posting an intra-day low of $20.30 on August 15th, shares of Ansell have traded 12% higher to reach $22.81 in early ASX trade today. 

The August low coincided with their FY17 earnings report. Part of that report focused on the level of earnings based in USD and how an stronger AUD could dampen results. 

The AUD/USD has now dropped over 5% since trading at .8125 on September 8th. As a result, ANN shares have pushed higher. 

We currently see ANN trading at 18X earnings and estimate FY18 EPS around USD .95 cents. 

As such, we consider ANN a good buy/write strategy up to $23.50 to increase cash flow and enhance portfolio returns. 
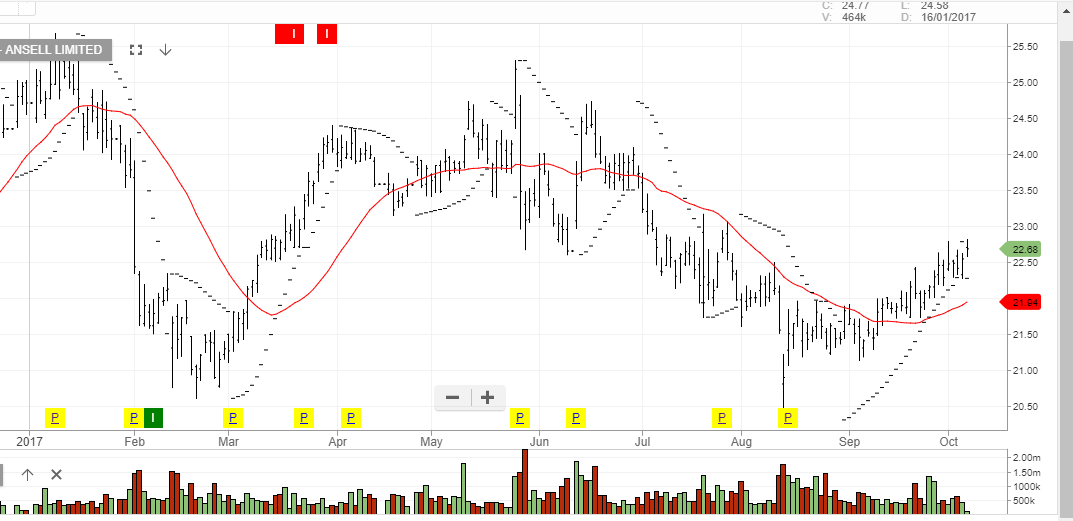
Ansell


Big Miss In Retail Sales

Local economists had expected Australian retail sales to have grown by around 0.3% after a flat report in July.

Instead, retail sales fell by 0.6% in August, and, adding insult to injury, revised the July report to show a 0.2% decline. It is the first back-to-back decline in five years.

Retail names HVN and JBH have both seen their share prices drop over 15% since mid-August and yesterday’s report won’t likely give them a lift.

Over the medium-term, we see scope for HVN to trade back to $3.65 and JBH to slip to $21.70.


Harvey Norman

JB HiFi


Trade Update: Is Telstra Forming A Base?

Shares of TLS have been on a protracted downtrend since mid-February when their shares traded as high as $5.22.

Earlier this week, TLS Chairman John Mullen met with institutional investors to assure them that the dividend is unlikely to be cut further.

Telstra announced in September that its 2018 full-year dividend would be reduced by 30% to 22 cents a share…..which Mr Mullen said is effectively the floor.

At the current price of $3.45, a 22 cent dividend pencils out to a 6.3% yield.

It’s our base case that most of the bad news about TLS is priced in and accumulating shares in this price range is a reasonable investment.


Telstra


Woolworths: Expect More Downside

On August 23rd, shares of WOW traded as high as $27.75. The current price of $24.60 is over 11% lower in just over a month.

Yesterday the ACCC announced that it will delay its final decision on BP’s proposed $1.8 billion acquisition of WOW’s 527 petrol station sites.

This delay isn’t a bullish factor for the company, but we expect the deal to get over the line and support the share price.

Technically, there is a support level in the $24.20 area which dates back to January of this year. This support level could be tested in the near-term.

Woolworth’s


ETF Update: BetaShares BBOZ

The XJO 200 Index continues to trade within a broad, sideways “Flag” pattern bound by the June 8th low of 5624 and the June 15th high of 5834.

The index is currently trading at 5666, which puts the key support level of 5624 within reach. A break of this level would open up range extension to the downside and find the next key target at 5578.

Investors looking to profit from a move lower in the XJO can buy the BetaShare ETF with the symbol: BBOZ.

BBOZ is an inverse ETF which means the unit price increases as the XJO Index trades lower.

BBOZ also has a 2.5% weighting, which means a 1% move in the XJO will have a 2.5% impact on the unit price of BBOZ.

The current price of BBOZ is $17.80.

We estimate that unit price of BBOZ will be $19.50 when the XJO trades down to 5578.

ASX XJO Index

BetaShare Inverse ETF: BBOZ


US Stock Update: Grinding Higher Into Earnings Season

US equity markets lifted for another record high across the board on declining volume.

Even the broad-based Russell 2000 Index hit a fresh record of 1,512 on its eighth consecutive trading day of gains. This is the longest streak since just after the US election in November.

It’s difficult to imagine this pace will continue and equity valuations at these extreme levels remain exposed to various unfavorable surprises.

One of these surprises could come within two weeks as US earnings season begins.

As illustrated in the chart below, there is a clear and widening divergence between the Russell Index and the expected earnings per share.

Russell 2000 Index