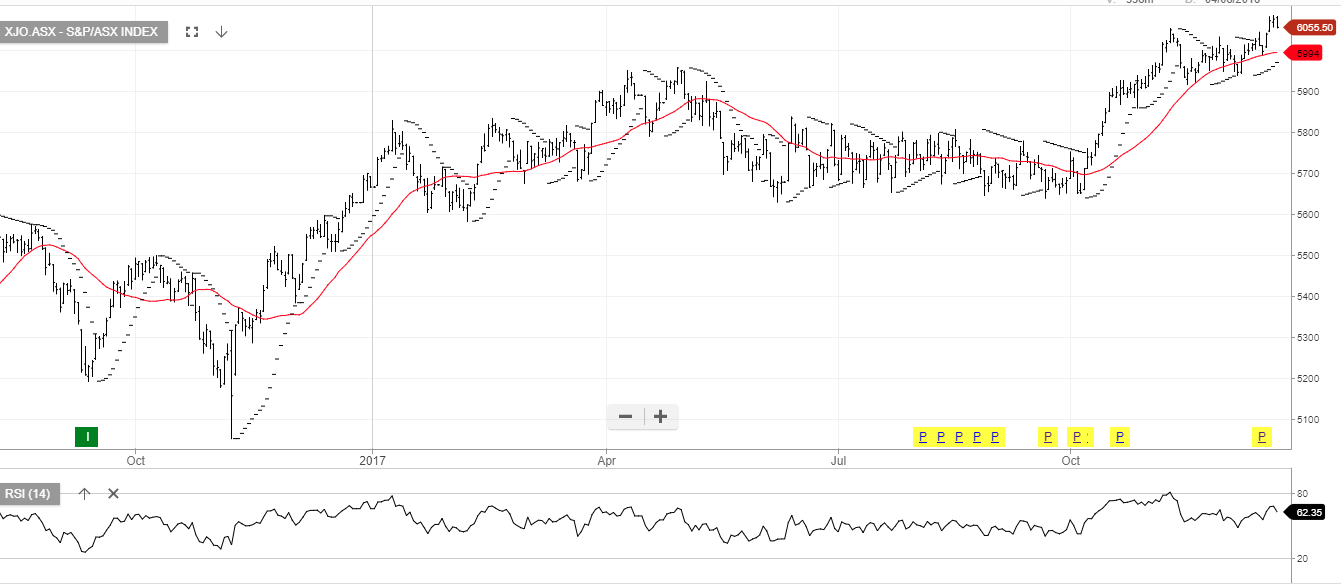
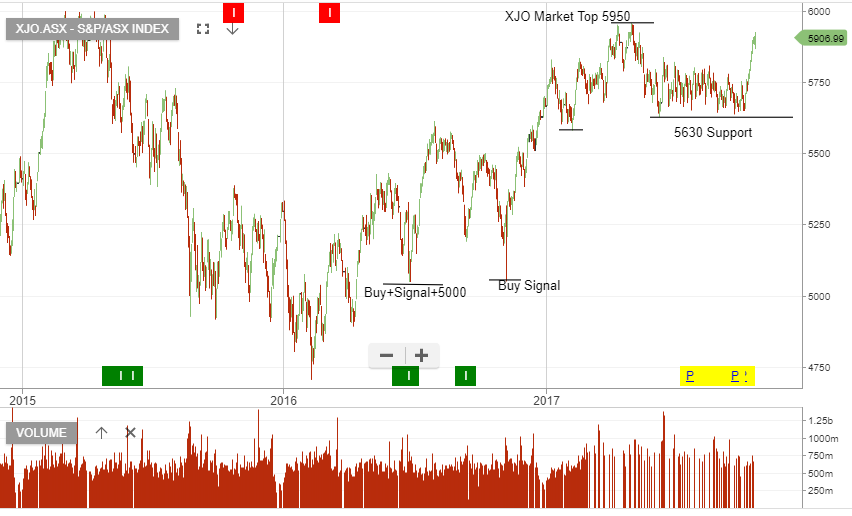
The last time our ALGO engine gave a signal in the XJO Index was on September 8th, 2016; this was a buy signal at 5227.
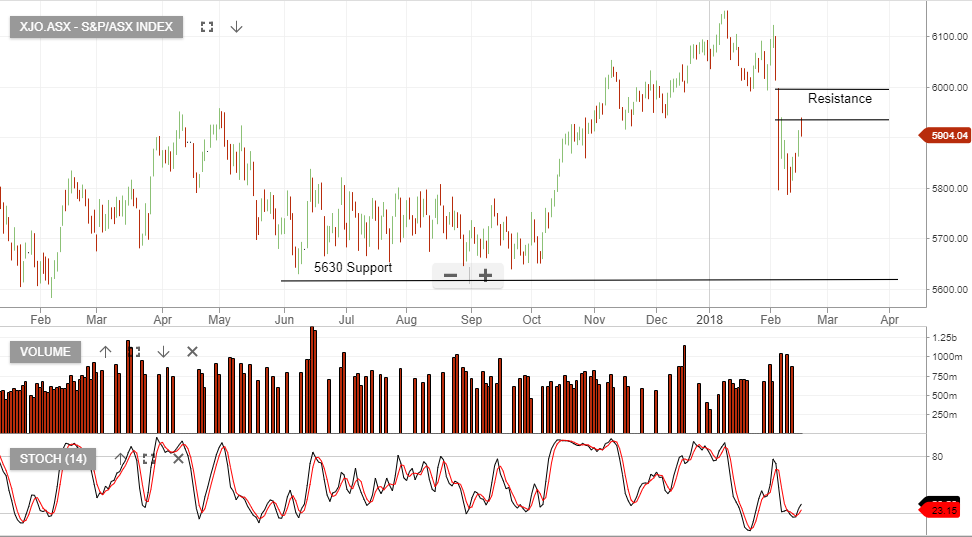
It isn’t surprising that there hasn’t been a more current signal considering that the index has traded in a wide, sideways trading range between 5650 and 5960 during 2017.
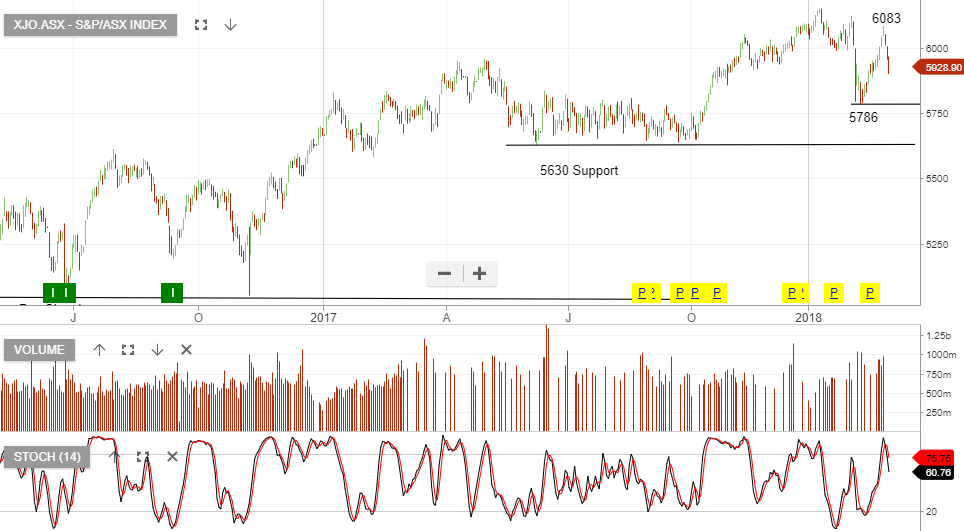
However, the recent break above 5960 has the technical structure of a “price exhaustion pattern” and could signal a correction lower into the new year.
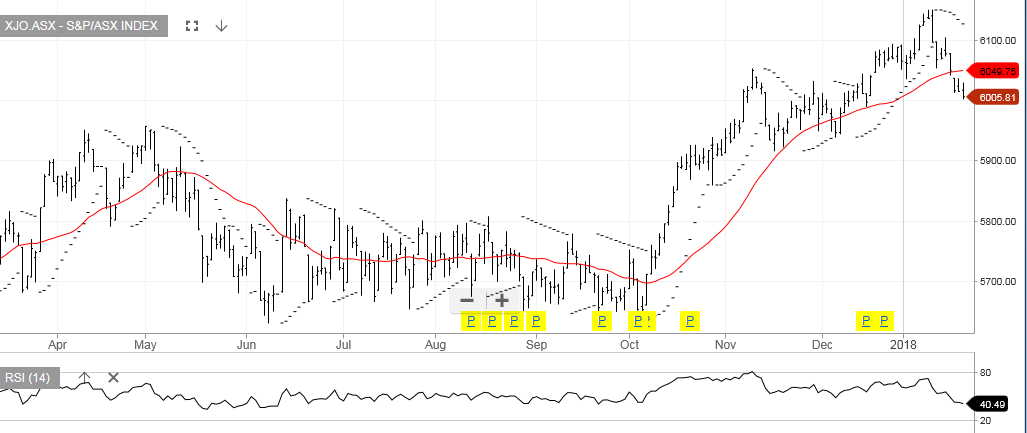
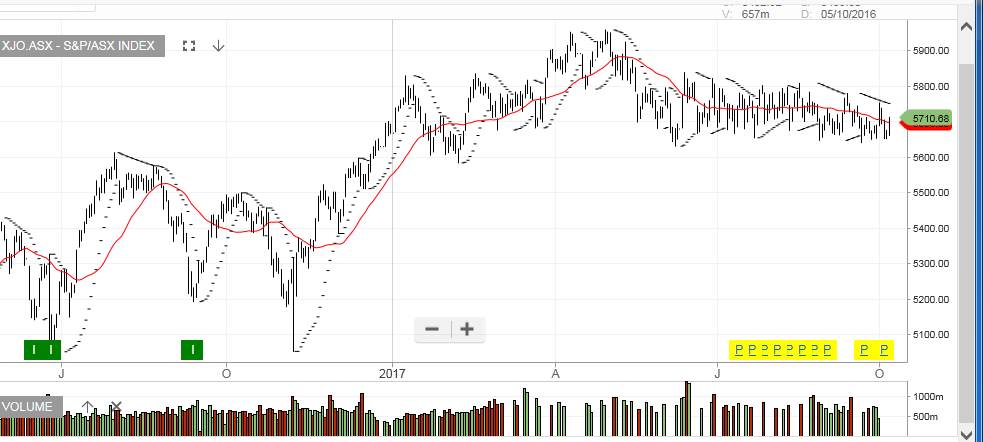
Looking at the internal momentum indicators on the daily chart, the November high of 6052 had a corresponding RSI reading of 80.00.
Interestingly, the higher print from December 20th at 6083, had a lower RSI reading of 63.00.
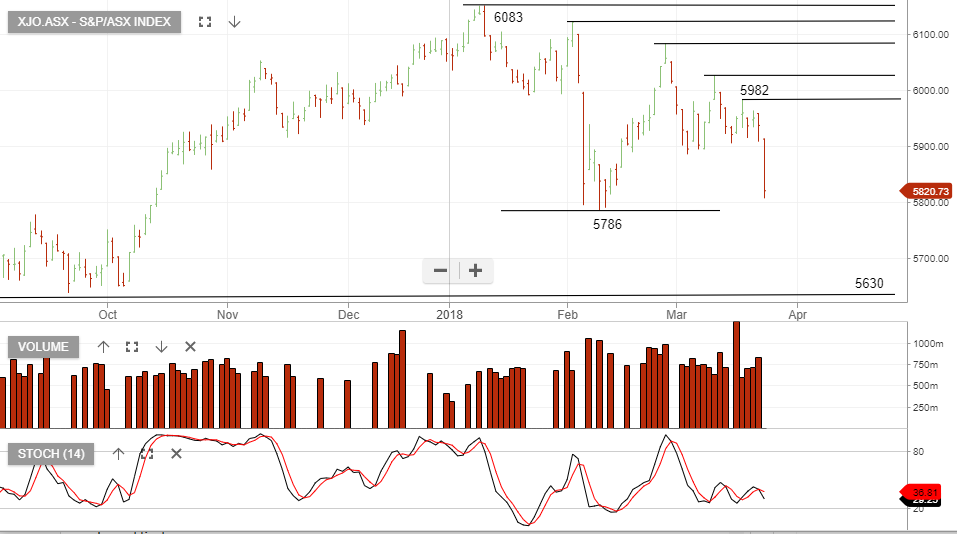
This divergence in momentum suggests the index is nearing a medium-term high and could offer a shorting opportunity. The next key support level is the November 16th low at 5916.
The XJO Index is available to trade on our SAXO Go platform as both a CFD and a futures contract.
 XJO Index
 XJO Index
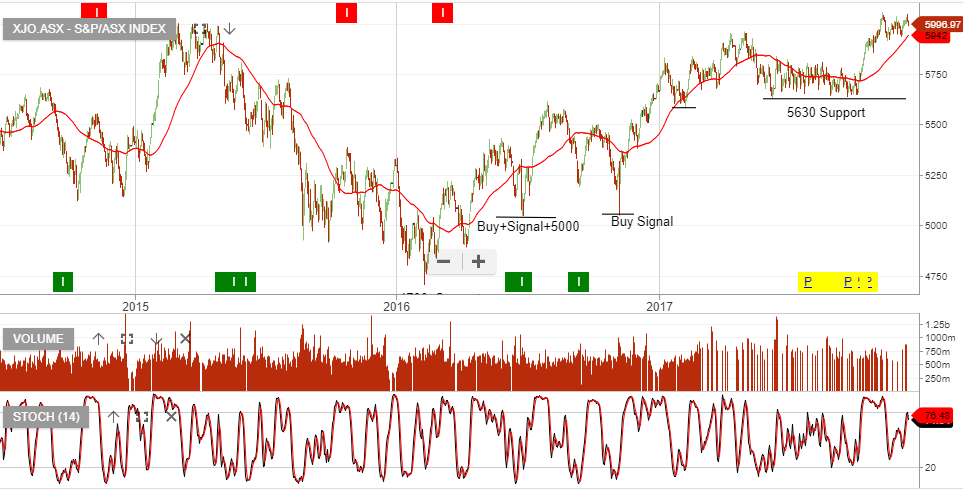
 XJO 200 Index