Key US Data: Retail Sales

US economic data will dominate Friday’s trade with the release of retail sales figures before the open of the US stock market

Consensus forecasts expect the Commerce Department to announce retail sales rose 0.7% in December following a 0.1% increase in November. In the USA, consumer spending accounts for 70% of  GDP growth which makes this report a closely watched indicator of overall economic activity.

Earlier this week, the ABS announced Australian retail sales rose by .2%, missing expectations for the first time in four months.

US Bank Earnings Preview

The fourth quarter earnings season kicks into high gear this week when the first of the major US banks report tomorrow night. Expectations are mixed, based on forecasts that include the impact of the FED raising interest rates and the Presidential election.

Bank of America and JP Morgan are both expected to report solid bottom-line growth. On the other hand, Wells Fargo is expected to say that its earnings have slipped from a year ago.

Below is a quick overview of what is expected from these three banks.

BoA Q4 profit is expected to come in at 38 cents per share, which would be close to a 30% gain from the year-ago period. The consensus has earnings pegged at 40 cents per share.

JP Morgan is expected to announce it had earnings of $1.47 per share, which would be up from $1.32 per share a year-ago on revenue of $23.70 billion.

Wells Fargo is expected to post Q4 EPS of $1.00 per share which is down three cents from a year ago on revenue of just over $22.00 billion.

US Wages and Inflation

The US Federal Reserve officially ended their stimulative policy of Quantitative Easing (QE) on October 29, 2014.

Since then, investors have been following the monthly Non-Farm Payroll (NFP) report for insight about how the condition of the US Labor market would influence US interest policy, the US Stock market and the US Dollar.

Within the NFP report, the three main components are the headline new job creation, the un-employment rate and weekly hourly earnings.

For most investors, the headline new jobs data has been the key metric for gauging whether the FED was likely to lift rates or leave policy on hold.

However, as the US is reaching a full-employment zone and the unemployment rate is nearing its lower bound below 5%, we are seeing a change in the policy implication dynamic towards wage growth and its impact on inflation.

Since the FED first lifted the FED Funds target rate in December 2015, the 10-year note yield has risen from 1.30% to 2.50%.

The FED understands that US wage growth is feeding directly into core inflation aggregates and will likely  shift their policy-making focus away from new job creation to wage growth during 2017.

In last Friday’s NFP report, wages rose .4% for a new cyclical high on a year-on-year basis to 2.9%. This is the fastest pace since 2009. We see the importance of the wage component increasing through the year as the knock-on effect into core inflation is seen in subsequent data sets.

In other words, as we move further into 2017, it’s reasonable to expect investors may be taking positions in the US stocks, bonds and the US Dollar based more on the growth of weekly wages than the number of new jobs created.

On balance, we consider the recent rise in wages as a transitory event which may trigger short term headwinds to the recent stock market rally. Over the longer-term, we still consider the Bull market in stocks to continue with a gradual rise in 10-year yields.
 

Crude Oil Dumps on Iraqi Export Data

The price of West Texas Intermediate (WTI) crude oil dropped over $2.00, or 3.8%, to $51.90 in New York trade as Iraqi exports posted a record high for the month of December.

This is the biggest daily drop in over five weeks as investors are now concerned about Iraqi compliance with the OPEC production cuts agreed to on November 30th in Vienna.

Crude Oil posted its biggest gain since 2009 last year, largely based on the agreement from OPEC and 11 other countries to curb output starting January 1st.

Non-compliance has been a recurring theme in previous OPEC agreements, and the Iraqi export data may be the first sign of a crack in the most recent production accord.

The close below $52.00 in the front month WTI contract is the first trade below the 30-day moving average in over a month and suggests further downside extension below $51.50.

On the ASX, Oil Search (OSH) reached a 2 month high of $7.45 yesterday but will likely trade lower today. Technically, we look for initial support at $7.00 with the Pre-OPEC key support level at $6.40.

Aussie Dollar Pointing Higher

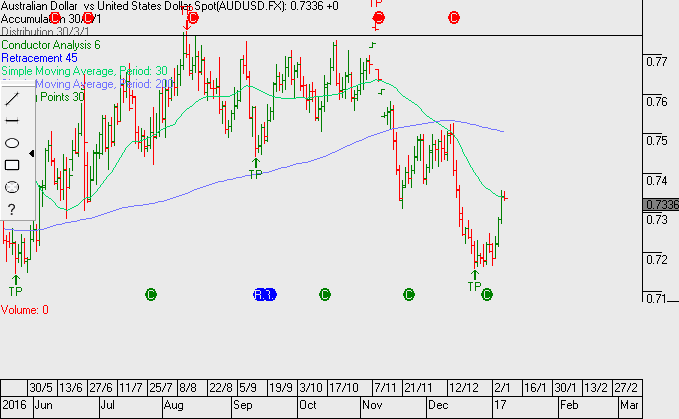
After holding above long-term support at .7150 going into the end of the year, the Australian Dollar has started 2017 on a firmer note. Higher prices for Copper, Crude Oil and Gold combined with the sharp rise in Australian Service Sector activity have added to the positive fundamental tone.

The technical picture has also improved as general US Dollar weakness has lifted the Aussie above its 30-day moving average near .7340 for the first time since early November. This morning’s better-than-expected Trade Balance report should keep the currency well bid throughout the Asian session and into the weekend.

With the US Non-Farm payroll data expected to print a little softer tonight, we see scope for the recent move in the AUD/USD to extend back to the December 15th high of .7430. We would consider that price a good level to exit long positions.
Chart – AUD

Gold: A Corrective Move Higher

In our 2017 preview, we noted that Gold was ending the year in a  stabilization pattern after falling sharply from the November highs. This fall saw the yellow metal drop from $1330 to $1120 (16%) in just over a month.

So far this week, Gold has moved from around $1140 to the current level of $1180. We feel this move is a combination of short-covering and a generally weak tone in the US Dollar. Technically, Gold has posted its first close above the 30-day moving average since November 9th, which suggests that this corrective move has more upside potential in the near-term.

Our base case is that the US Dollar will continue to consolidate from its sharp rally over the last two months, which will lift Gold prices higher. The daily charts point to the November high of $1220.00 as the next significant upside target within this corrective phase, and a good place to exit long positions.

AMCOR – FX Headwinds

After meeting price resistance at $15.00 yesterday, shares of Amcor have opened over 1% lower $14.80.

Earlier in the year, the firm’s multi-currency revenue stream was considered a tailwind. However, with the USD trading sharply higher against the AUD and the EURO, these trends are now seen as a headwind to market earnings forecasts.

This means that our 1H 2017 forecasts are expected to show a marginal fall in profits from US$ 310 million to just above UD$ 300 million, or about 6% lower on a reported USD basis. For the full year in FY 2017, our constant FX forecasts are unchanged at US$ 700 million, which implies 5% YoY growth.

As such, we expect Amcor shares to trade in a sideways pattern over the medium-term and look to buy on a pull back based on the Algo signal alerts. At this point, with the share price in the upper band of the 6-month range, we will sell the covered call option to enhance yield and reduce volatility.

Chart - AMC
Chart – AMC


FedEx Earnings

Shares of FedEx are down 3% at $192.80 in after market trade as the parcel delivery giant fell short of fiscal Q2 earnings estimates after the NY close today.

FedEx announced Q2 earnings of $2.80 per share on revenue $14.9 billion, while the market was expecting earnings of $2.90 with revenue climbing to $14.95 billion.

Total operating margin shrank to 7.8% from 9.1% a year ago, due to the FedEx “Ground” unit’s network expansion and increased purchase transportation rates, as well as higher IT expenses. Looking forward, adjusted FY 2017 earnings are still seen in the $12.00 to $12.25 range.

On balance, FedEx has offered good shareholder value this year climbing over 25% since January. We would expect to see buyers at, or around, the initial support area of $173.00

Global Macro: Strong Trends Into Year End

Political events and Central Bank policy moves have been driving global financial markets over the last two months. During this time, direct influence from weekly economic data seems to have diminished. With dealing desks starting to thin and investors looking to the holidays, this is likely to remain the case over the next two weeks.

But even as financial markets slip into holiday mode, there are several powerful trends that are worth watching. Three of these trends have been particularly vigorous: The USD climb against the JPY, the rise in the US 10-year yields, and the rally in the SP 500 have all been very robust. In fact, these three markets have risen six weeks in a row and finished higher over nine of the last 11 weeks. Similarly, the USD Index and US 2-year yields have risen, while Gold has fallen, in seven of the last 11 week.

The key issue now is whether these trends will be extended, or if a profit taking phase will be seen into the end of the year. Arguments that these trends have gone too far too fast are now several weeks old. And even though technical readings are even more overstretched, there aren’t reliable fundamental arguments for taking aggressive positions in the opposite direction……….not yet, anyway.

The basic psychology of these recent trends suggests the new US administration will act swiftly to enact a comprehensive (fiscal) stimulus package; which will allow US stock valuations to expand and the US Dollar to appreciate vis-a-vis higher domestic interest rates.

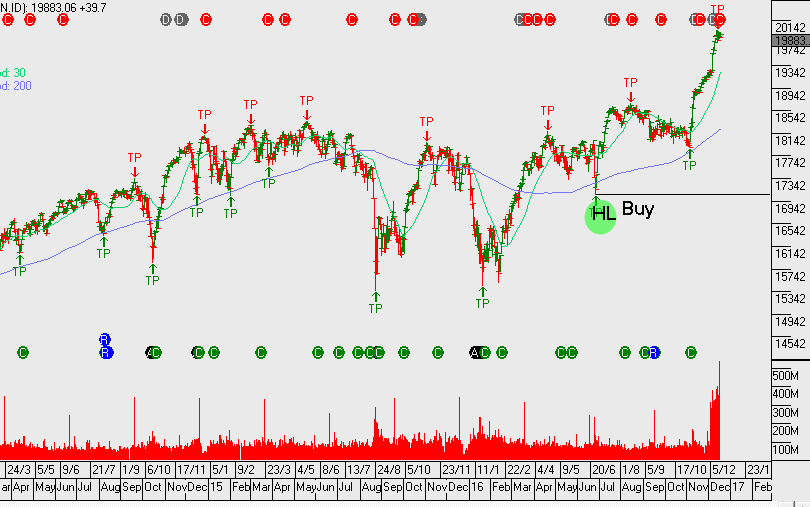
On balance, we expect the current trends of higher US stocks, firm US Dollar and a steepening yield curve to continue, even as market flows edge into holiday mode.

Dow Jones

Gold: A Corrective Bounce

Gold has found initial support at the $1120.00 level and has posted a corrective move higher over the last two days.

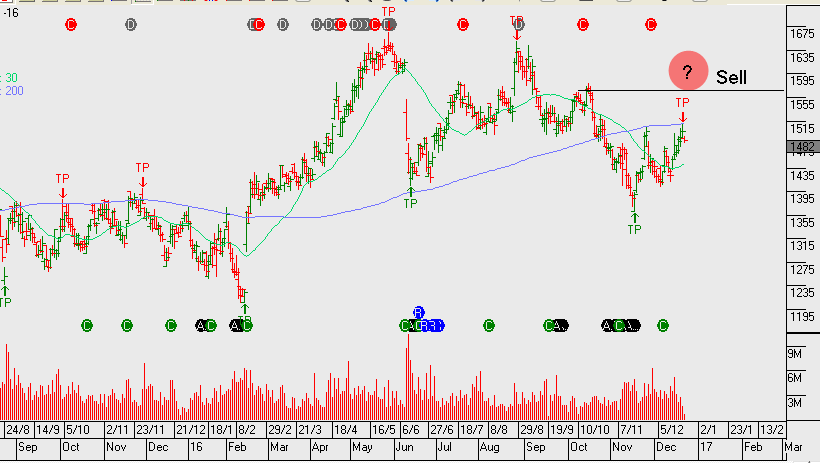
The yellow metal is now approaching the technical downtrend line near $1155.00, which we feel will offer stiff resistance. The 30-day moving average is currently at $1186.00. The RSI has been in oversold territory below the 30.00 mark for over a month, so some price consolidation is expected before extending lower.

Newcrest Mining is currently 3.5% higher at 17.40. We view this move as corrective and would expect sellers to return at , or around, the 18.60 level.

Chart - NCM
Chart – NCM