Dark Clouds Forming Over Wall Street

Up until last week, US Stocks had spent the last five months gradually moving higher, without many big daily gains or losses.

They had drawn strength from rising U.S. corporate profits and continued growth in the economy, along with recoveries in Europe and other EM regions.

It’s clear that investors still believe that if the global economy or equity markets ran into serious trouble, G-7 central banks would step in to help, just as they did after the 2008-09 global financial crisis.

Given the historically low volatility measures in the markets, it’s not surprising that on August 7th, a small 52 point rally  (essentially all from Apple Inc) brought the Dow Jones 30 Index to its newest milestone of 22,062.

But this new record high belies the growing unevenness of the index.

Shares of Boeing, McDonald’s and health insurer United Health have contributed more than 700 points of the 1,000 points the Dow has gained since March 1, when the index topped 21,000 points for the first time.

This means that 10% of the components of the Dow index have been responsible for 70% of the overall gains over the last five months.

Meanwhile, Goldman Sachs and IBM, which helped lead the Dow’s surge in late 2016 and early 2017, have come crashing back to earth and are currently the worst performers in the Dow index this year.

A 1,000-point rally in the Dow 30 isn’t what is used to be a few years ago. As the index trades higher, each round-number milestone represents a smaller percentage move.

When the Dow advanced from 10,000 points to 11,000 points in early 1999, it was a 10% rally. By contrast, the move from 21,000 to 22,000 translates to a gain of just 4.8%.

The Dow index is more than 120 years old, and experts and market-watchers constantly debate how accurately it represents the overall health of the market. With only 30 companies in the index, the Dow reflects much less of the broad economy than the Standard & Poor’s 500 index, the NASDAQ or the Russell 2000, which institutional investors pay more attention to.

From a technical perspective, Dow points are also based on the individual stock price instead of the relative value of the company.

So a 1% move for an expensive stock like Boeing or Goldman Sachs, both priced well above $200 per share, will move the Dow Index more than Microsoft, worth around $70 per share, even though Microsoft has a capitalization of more than $550 billion compared to about $90 billion for Goldman Sachs.

This type of internal price dispersion is not limited to the narrow Dow 30 Index. Internal price dispersion has now become apparent in the SP 500 Index, which, as a much broader index, has much more significant ramifications for future share price valuations.

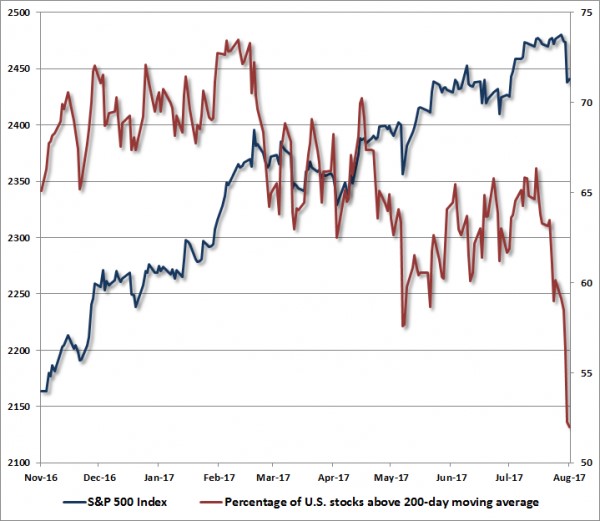
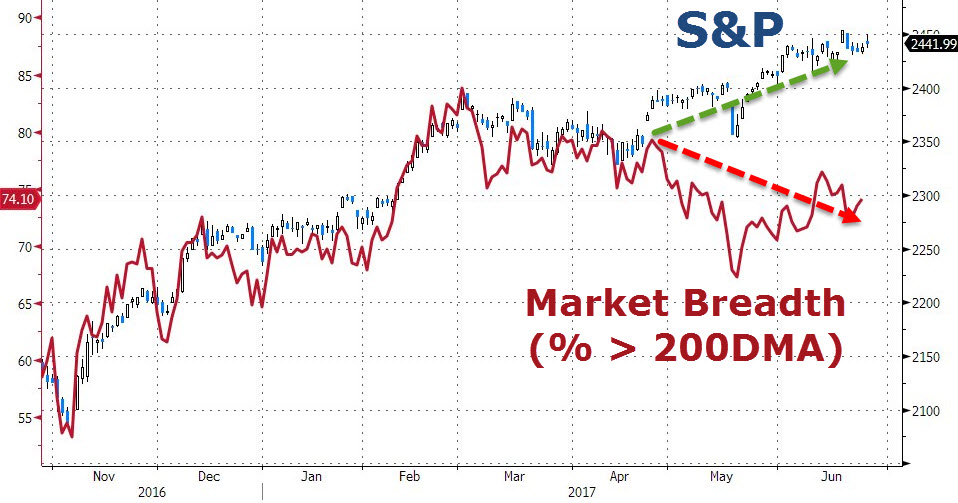
For example, a growing proportion of individual stocks in the SP 500 are now priced below their respective 200-day moving averages, with just a handful of names carrying the index higher over the last few months.

 This widening divergence in leadership, (as measured by the proportion of individual stocks hitting  new highs versus new lows), is not a bullish indicator for US stocks going forward.

The chart below illustrates the percentage of U.S. stocks above their respective 200-day moving averages, compared with the S&P 500 Index. The deterioration and widening dispersion in market internals is no longer subtle and points to price momentum turning lower.
Further, this degree of dispersion suggests that not only is risk-aversion rising, it is also picking up pace.

Across history, this sort of shift in individual share prices, coupled with extreme overvalued P/E’s and over-bullish sentiment, has been the hallmark of major price peaks and subsequent market corrections.

Looking across the financial landscape, we see several other potential triggering events which could signal a material correction in global equity markets. Of these potential market inflection points, five stand out as troubling and worth noting.

  1. Debt Ceiling
  2. Bubble level PE’s
  3. Maximum Financial Engineering
  4. China Asset withdrawal and structured product issues
  5. US credit cycle deteriorating – credit cards, autos.

Within this list, the most severe market event would be the failure of the US Congress to raise the debt ceiling in time to prevent a shutdown of the US Government: this event caused 16% drop in the US SP 500 in 2011, as referenced in our August 14th blog report titled “Black Monday 2011, revisited.”

On August 1st, the US Treasury Department announced that the debt ceiling, (the statutory limit of outstanding debt obligations that the federal government can hold),  must be raised by September 29th.  After lawmakers return from their summer break, that will give Congress 12 working days to pass legislation to get to President Donald Trump’s desk.

If this deadline is breached, it could lead to disastrous consequences for the Federal government, the US economy, and the global financial system. If the debt ceiling is not raised, the US government would lose the ability to pay bills it already owes in the form of US Treasury bills and could lead the US to default on some of that debt.

The possible fallout from a default, according to a recent study by the Treasury Department, would include a meltdown in the stock and bond markets, a downgrade of the US’s credit rating and the undermining of the full faith and credit of the country.

It’s our base case that despite the potentially dire consequences, there is some confidence but no guarantee that factions in Congress, with a variety of competing interests, will be able to come together on a deal to raise the limit.

And even though the US Government has raised the debt ceiling 78 times over the last 57 years, the political uncertainty in Washington is making investors realize that the chances of successfully negotiating the debt ceiling legislation without a Government shutdown are dwindling.

Institutional investors in the US Credit markets have already started pricing in a Government financial disruption as illustrated in the spike in US credit default risk and the inversion in the US T-Bill curve.
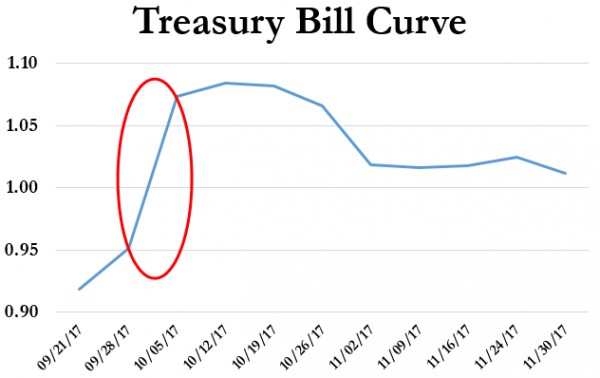
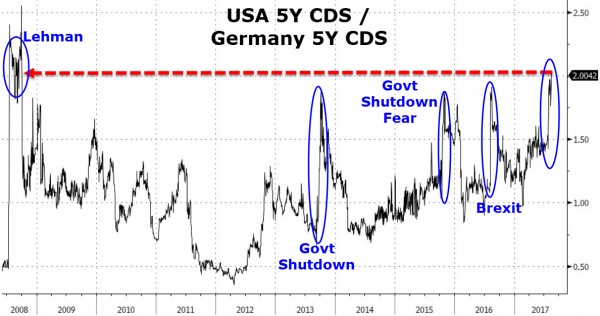
Unfortunately, based on recent  negotiations for Health Care and Tax reforms, the Congress has not proven that it’s lawmakers are motivated to do what’s best for the American people, or that it can get anything done.

What’s more, the debt ceiling debate is likely to become ultra-politicized with special interest spending provisions attached to the final legislation.

This confluence of internal share price dispersion, combined with the backing up of risk aversion in the short-term credit markets, alerts us to a market condition which could lead to profound disappointment for investors.

All of our key metrics of expected market risk/return prospects are unfavorable at current market levels.

Some market commentators have projected that the SP 500 will complete the current re-pricing cycle at an index level up to 60% lower, or in the low 1000 handle. Our research doesn’t point to a level that low, but we do believe the market has scope for a 20% correction over the next three months.

As such, we strongly urge our clients and subscribers to examine all of your investment exposures, and ensure that they are consistent with your actual investment horizon and tolerance for risk.


US Update: Divergence In Market Breadth

As the SP 500 continues to trade near all-time highs, market analysts are reviewing various metrics to determine whether US Stock prices have more upside, or if they are ready for a downside correction.

One of these metrics is “Market Breadth.” Market breadth is a technique used to gauge the direction of the market by measuring the number of stocks trading higher versus the number of stocks moving lower

“Positive” breadth occurs when more stocks are moving higher than lower and vice versa for “negative” breadth.

The breadth numbers are used to determine whether the market has positive momentum or negative momentum.

The chart below shows that the SP 500 and market breadth have been diverging since late-April.

To put this divergence into perspective, as of last Friday, nearly 40% of SP 500 stocks were trading below their 200-day moving averages. In addition, 6% of the stocks listed on the NYSE hit new 52-week lows last week.

We will watch these measures closely to see if the current market pricing is resolved to the upside, or if the US Indexes commence a correction lower.

SP 500 vs Market Breadth


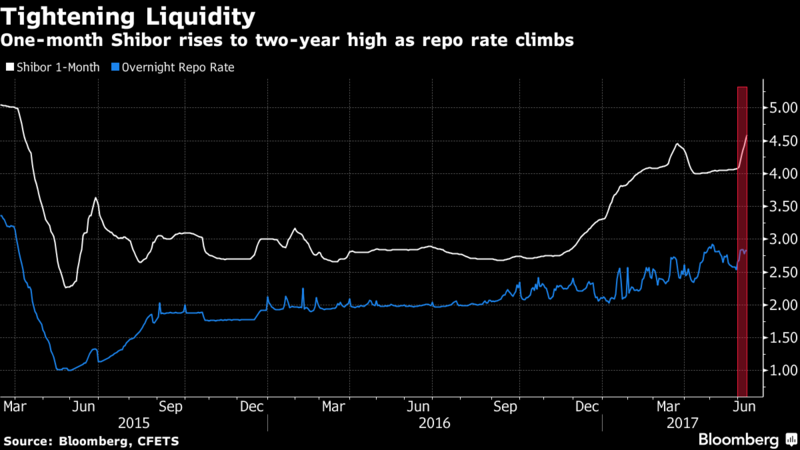
SHIBOR Spikes Higher

SHIBOR refers to the “Shanghai Interbank Offered Rate”. On Friday the one-month rate stood at 4.65%, the highest in over two years.

To put this in perspective, one-month rates in the US are at 0.85% and one-year rates in Australia stand at 1.63%.

And while Chinese central bank officials reject any suggestion that the tighter lending rates were a sign of instability or a source of increased financial risks, global financial markets have been acutely impacted by Chinese banking shocks in the past.

At this point, the one-month SHIBOR rate is now higher than the one-year Chinese Prime lending rate of 4.30%, which is unsustainable.

The knock-on effect is that a sharp contraction of Chinese capital flow will reduce Australian exports and could even distress local real estate markets.

We will watch this development with interest and how it could translate into the Australian share market.

Chinese SHIBOR

Take a Sneak Peak at Leon’s Charts

Did you know, that as a subscriber, you can always take a sneak peak at Leon’s personal charts?  It’s pretty easy…

When viewing a chart, press the Investor Signals logo to view Leon’s version of the chart.

If you’re not a subscriber, then register for our Free Trial to try it out today or get in touch with us.

If you are already subscribed, then try it out now.

US Update: Trump Puts Healthcare Reform On Hold

US Stock Indexes finished the week mixed as many investors were focused on how the House of Representatives would vote on the administration’s bill to repeal major parts of the current health care program, referred to as Obamacare.

As the day progressed, the DOW and SP 500 swung between positive and negative territory as news reports gave conflicting stories about whether the bill would pass, or even be voted upon.

In the end, after Mr Trump’s ultimatum failed to yield more “yes” votes , the embattled bill seeking to start the healthcare reform process, and free up almost a trillion dollars in tax dollars, was pulled from the floor.

As a result, Mr Trump suffered a second consecutive blow from within his own Republican party. This party dissension will likely cast doubts on the President’s ability to deliver on other policy measures including; tax reform, infrastructure spending and the debt ceiling legislation.

The announcement that the vote was cancelled happened too late in the day to have any material impact on today’s trade.

However, going into next week, investors will have to address the question of how Mr Trump can now unify his own party behind his administration; and whether this legislative defeat will “deflate” the “reflation” trade, which was triggered after he was elected?

US Payroll Preview

The  US Non-Farm Payroll (NFP) report, scheduled for 12:30 am Sydney time tonight, could have a significant impact on global financial markets.

In a speech last Friday, FED Chief Janet Yellen was very clear that steady employment growth and rising inflation were the key indicators guiding US interest rate policy.

Tonight’s report will reflect both the number of new jobs created in the month of February and the pace of wages growth.

Wednesday’s release of the ADP private sector job’s report printed much higher at 298,000 on expectations of 184,000. And while the ADP data is far from a foolproof indicator of the NFP report, it would be a big surprise if the headline jobs number printed much below the 200,000 consensus forecast.

Against this backdrop of an imminent FED rate hike, US 10-yr bond yields have reached a three year high of 2.64%, Gold has dropped below $1200.00, Crude Oil has fallen more than 8.5% this week and Copper has lost more than 6% over the last 10 trading sessions.

It’s likely that a NFP print of  230,000, or more, will be bullish for the US Dollar and negative for Global equity markets.

China Lowers Their GDP Growth Target

While addressing the 3,000 members of the National People’s Congress (NPC) in Beijing, Premier Li Keqiang announced that China’s economic growth target has been cut to around 6.5% from last year’s estimate of 7%.

China’s GDP grew at the slowest rate in 26 years last year, and Mr Li pledged he would address the state sponsored “zombie enterprises” which produce more coal and steel than the market needed.

Similar pledges have proved hard to fulfill in the past.

However,  it appears that NPC leaders are more committed to slower growth to deal with the painful reforms triggered by the rapid build-up in debt from both the official and shadow banking sectors.

Against the backdrop of last week’s disappointing Australian trade balance numbers, it will be worth watching to see if the RBA makes reference to this development during their monthly statement tomorrow.

A contracting Chinese economy would increase the likelihood of another RBA rate cut and a lower Australian Dollar.


Aussie Dollar Falls Hard On Trade Data

The Aussie Dollar fell hard last night breaking the key support area of .7600 versus the US Dollar and closing the NY session down almost 1.5% for the day.

After consolidating for several weeks above .7650, the AUD/USD finally broke down. Although recent economic reports have been fairly good, yesterday’s weaker trade balance figures were a sharp reminder of the damage a stronger currency can do to an export dependent economy.

Analysts were looking for the January trade surplus to increase to 3.8 billion, but instead it shrank to 1.3 billion; less than a third of the expected level. The main draw on the trade balance were exports, which fell over 3% for the month.

The RBA has been clear that a stronger AUD will act as an economic headwind as Australia moves away from a mining-based economy.

Over the last 18 months, the AUD/USD has traded in a broad range between .7000 and .7750. Technically, last week’s high of .7740 could stand as a medium-term top as US Dollar strength pushes the AUD toward the bottom end of the range.

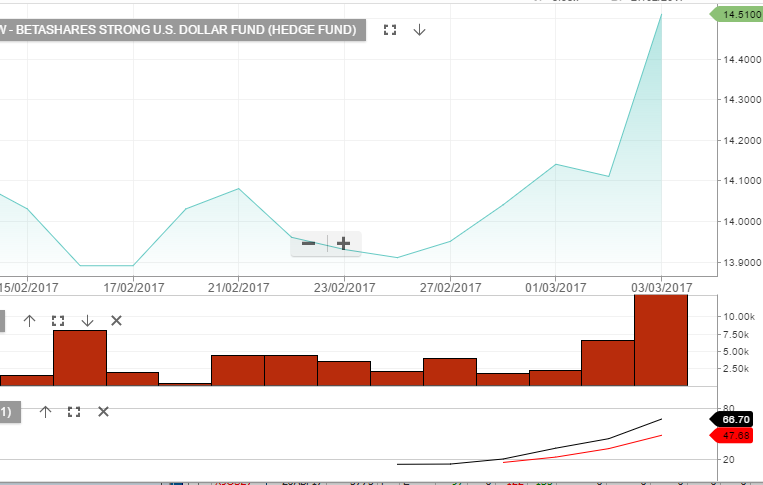
Investors looking to benefit from a move lower in the AUD/USD can consider the BetaShares AUD-based Exchange Traded Funds.

BetaShares offers two ASX-listed ETFs which increase in value as the AUD trades lower against the USD.

These two ETFs are called: USD, which is unweighted, and YANK, which has an approximate weighting of 2.5 to 1.

Contact us for more information about these AUD-based ETFs.

Chart – YANK