Global Macro

In the lead up to last Friday’s US Payroll (NFP) report, there were several Federal Reserve officials, as well as many market commentators, who believed that a better-than-expected jobs report would increase the likelihood of  a November rate hike. Even FED “dove “Charles Evans seemed to warm to the idea that above trend growth in employment would justify a near-term move in the Fed Funds target.

However, the less than spectacular Non-Farm Payroll report saw the odds of a November move scaled back materially, the USD lose some of its gains for the week.

We have never  really supported the speculation about further rate normalization at the November FOMC meeting. There is no historic precedent for any FED policy change so close to a Federal election and the current FED will likely want to show a political and independent posture.

In addition, the November FOMC doesn’t have a scheduled press conference nor are any updated economic forecasts scheduled for release. These scheduling issues wouldn’t completely preclude a rate hike if the recent data was extremely strong; which is not the case. On balance, the NFP report was solid even though the headline new jobs component was weaker-than-expected. Private sector jobs gained 167,000, while the participation rate rose to 63% which is the best rate since February of 2014.

Chart – US 10yr

10yr

Dow Jones

dow-jones


Global Macro

Over the past 12 months, the correlation between the EURO and Eurozone (EZ) share market has gone through several different phases. Earlier in the year, the single currency was sold off on risk aversion when EZ equities were showing weakness. A few months later, the EURO was bid higher when EZ stocks fell as fund managers allegedly unwound currency hedges while cutting long stock positions.

However, during last Friday’s LDN session, the EUR/USD tracked the German DAX index with pretty much a point-to-point correlation. As discussed in previous FX UPDATES, the legal and financial pressures on Deutsche Bank (DB), along with other EZ banks, has been a headwind for the EURO but so far hasn’t unravelled the current price or chart structure.

But last Friday was different. As the LDN session opened, the German DAX was pushed below the 10,200 level for the first time since early August. At the same time, the EUR/USD fell to the session low of 1.1160 and was well offered on the crosses. A well timed rumor that the US Department of Justice  (DoJ) was willing to lower their penalty demand on DB down to the $5.0 billion area triggered a 1.5% rally in the DAX and reversed the EUR/USD back up to near-term resistance at 1.1250.

With a full slate of data points from both sides of the Atlantic this week, FX Investors will be watching to see if this EURO-Equity connection of stronger EZ equities driving the EUR/USD higher has any staying power, or if it was just an end of month adjustment.

It’s our base case is that the DoJ rumor was just that and the market will be sensitive to ongoing litigation between the DB and the DoJ. Further, two of the key data points this week, US ISM aggregates and the US Jobs data, are both extremely currency sensitive releases which will drive USD flows.

On balance, we expect both the ISM manufacturing and services reports to bounce back from last month’s readings, which would be USD positive and SP 500 positive. The US Payroll data has been a volatile series over the last six months, but a print near the forecasted number of 170,000 new jobs should be good enough to keep the EUR/USD on a downward trajectory.

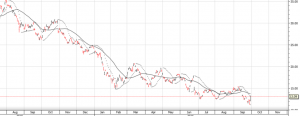
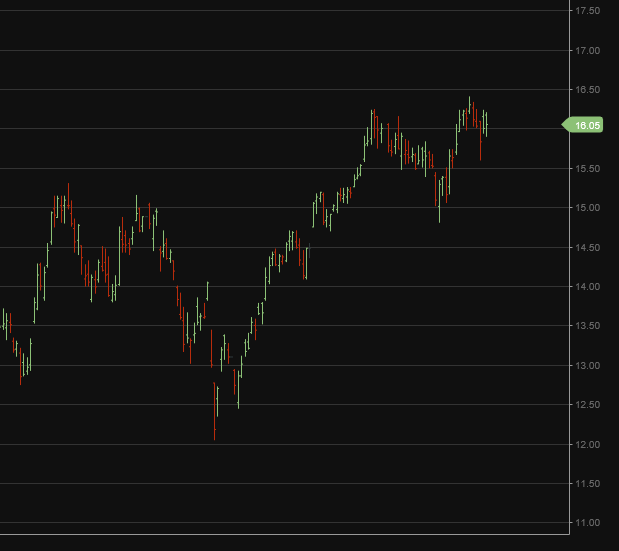
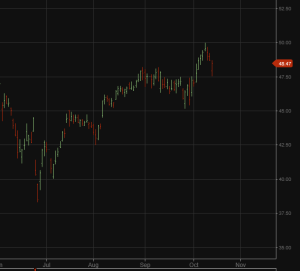
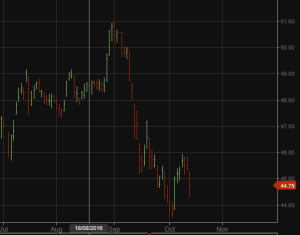
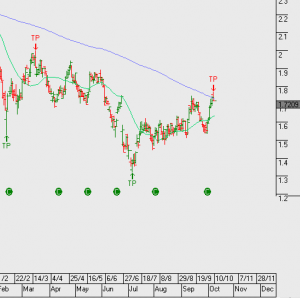
Chart – Deutsche Bank
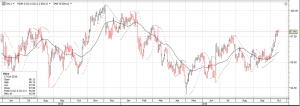
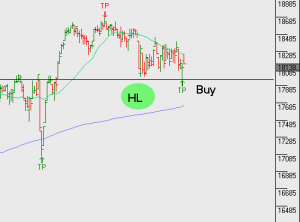
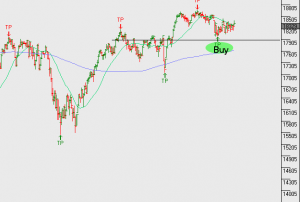
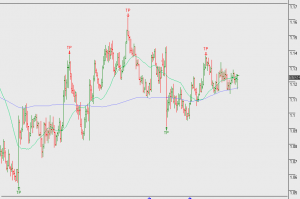
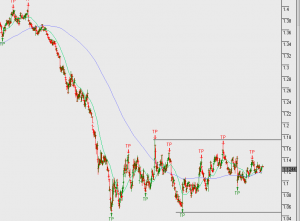
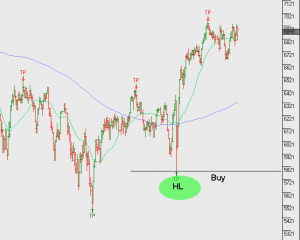
dbank


Global Macro

Today’s NY close will mark both the end of September and the end of the third quarter of 2016. Often times, these month-end, quarter-end trading sessions can see broad reversion moves within long worn price ranges. With the UK current account data scheduled for release today, could month-end flows lift the Sterling into the weekend?

Doing a straight quarter-to-quarter price analysis, the GBP/USD looks overdue for a substantial recovery. The pair started Q2 of 2016 at 1.4250 and started Q3 more than 10 big figures lower at 1.3225. Over the last couple of months, the GBP/USD has been trading in an inverse pennant formation bound by the 1.2850 level on the downside and finding resistance just under 1.3500.

During the same period, the FTSE 100 has gained just over 4%, which illustrates a combination of over expectations of widespread asset devaluation post-Brexit and the re-pricing of growth assets relative to the lower Sterling.

The UK balance of payment report is first-tier data set and has been heavily influenced by the sharp devaluation of the Sterling since the June 24th referendum. Market forecasts are calling for a contraction of the trade deficit from – £32.00 billion to -£30.00 billion. And while seeing the deficit shrink by 2 billion quid may not appear to be a large improvement, it’s still materially better than blowout numbers predicted by Brexit opponents.

Chart – FTSE

ftseEUR/USD

eurusd

Global Macro

With global financial markets firmly focused on central bank meetings in the US and Japan last week, it was easy to overlook the bad news delivered to Germany’s largest bank. On September 16th, the US Department of Justice (DoJ) demanded that Deutsche Bank (DB) pay $14 billion in penalties for their role in deceptive marketing practices dating back to 2005. More specifically, the DoJ’s claim is about the way the bank selected mortgages, packaged them into bonds and sold them on to investors.

These bonds are known as residential mortgage-backed securities and very few investors walked away from the DB products without damage.

DB is just one of several banks penalized by the DoJ with Goldman Sachs and Citi-Bank both settling with the DoJ earlier this year for $5 billion and $7 billion, respectively. With that in mind, it’s likely that DB will be able to negotiate a lower number over time. However, over the weekend, German Chancellor Angela Merkel  ruled out any government assistance for DB, which has not only pushed the share price to a 16-year low under €12.00 but also initiated enormous scrutiny on BD’s derivative and financing books.

In short, DB has more than €2.5 trillion of derivative exposure coming due or needing to be rolled over within the year. DB has had a serious reduction in its credit rating by Moody’s and has seen its share price drop 40% since January. The DoJ’s $14 billion demand represents more than 70% of DB’s current market value. Without going into the specific composition of the derivative book, it’s reasonable to believe that DB is probably not on the right side of all of these trades and that refinancing rollovers will put additional pressure on their bottom line.

With respect to the price of the Euro, one must ask the following questions: What is BD’s exposure to other troubled banks in Europe; specifically, the collapsing Italian bank system? And, now that Ms Merkel has ruled out state aid, will BD be able to pay the fine without a depositor bail-in? The ECB chief, Mario Draghi, is scheduled to testify on Monday in front of the Committee on Economic Affairs in Brussels. It’s a fair bet that DB’s stability and exposure will be addressed.

Even without the DB legal mess, the current technical pattern in the EUR/USD looks tenuous.

EUR/USD

euro

Global Macro

While there was never a consensus that the FED was going to lift the overnight target rate going into last week’s FOMC meeting, there were a couple primary dealers who cautioned that the FED might surprise the market. And while a .25% increase might not have much of an impact on the overall economy, it could have had a significant impact on global equity markets. Remember the sharp sell-off that the SP 500 experienced after the last rate hike in December, 2015. As such, we feel it would be helpful to have some idea of when the next rate adjustment is approaching, so that we could plan our investment strategy accordingly.

One indicator that might give us some insight as to what the FED is planning on doing, as opposed to what it’s saying its doing, is the change in excess reserves held by banks.  As you can see on the chart, the level of excess reserves fell considerably in the weeks leading up to the first step in interest rate normalization late last year. Starting in early November, excess reserves fell by over $200 billion in advance of the FED’s decision to raise short-term rates by .25% in December.

The FED used its reverse repurchase agreement facility (reverse repos) to drain excess reserves by exchanging Treasury securities on its balance sheet for reserves held by banks, thereby removing liquidity in the financial system which is consistent with a tighter monetary policy. Going forward, we believe it’s worthwhile to follow the repo market for signs that excess reserves are leaving the financial system as a signal that the FED is preparing further interest rate normalization later this year.

Graph of Excess Reserves of Depository Institutions.

excess-reserves

XJO Index Watch – Key Levels you Should be Tracking

Following last night’s decision in the US to leave rates unchanged, yield stocks will begin their recovery as we forecasted. See our list of stocks and entry levels from the post dated the 2nd September for further details on specific holdings.

Our base case is for the market to remain stable and quality oversold names will revert back to higher price levels . In addition, our strategy includes earning income from companies with limited but stable earnings growth using covered calls.

Below, I’ve identified key technical levels to watch in both the XJO and the S&P500 as a mechanism for remaining long the market with a bias toward buy side opportunities. Should the indexes reverse and trade below these levels, we shift our thinking to a more balanced view and begin identifying short trades to help balance the risk in client portfolios.

I’ve used simple numbering 1, 2 & 3, (in charts below), to identify the key breakdown levels that warrant a shift in strategy. To recap, we remain almost exclusively  exposed to long positions, with a balanced allocation across asset classes, and hold around 20 preferred names within the ASX top 50 index. In some cases we’ve allowed 5 – 10% capital growth in certain names over coming months. In other names we’ve sold tight covered calls to maximise the income from dividends and call option income.

If the market reverses through the first of our levels, (indicated by 1), we will start shifting our focus to short signals identified by our algorithm engines; which will then start to neutralise the long portfolio bias. When and if this happens, I’ll update you via the blog, otherwise, we continue to hold our “buy on the dip” position.

For more details you may wish to revisit the monthly strategy video posted earlier this week.

XJO 200 Index

xjo

S&P500 Index

sp500


Global Macro

The global financial markets appear to have entered a range bound phase based on two basic information sets: comments made by central bankers last week, and how that will effect the two central bank meetings scheduled for next week. The last 24 hours included rate decisions from the Bank of England (BoE), the Swiss National Bank (SNB) and a full slate of economic data from the US, but none of these risk events had much impact on G-7 currency rates.

If there was any market consensus from yesterday’s trading session, it was that the recent US economic data points have been soft enough to keep the FOMC from lifting rates next week, but not weak enough to push the USD Index much below the 30-day moving average at 95.30. The Fed Funds futures are showing less than a 20% probability of the Fed Funds target moving higher after next Wednesday’s FOMC meeting.

Interestingly, the USD/JPY, which makes up 14% of the USD Index price, has also traded down to its 30-day moving average at 101.80 after breaking above near-term resistance at 103.30 on Wednesday. The USD/JPY moved higher on expectations, of more aggressive stimulus measures from the Bank of Japan (BoJ) at their meeting next Wednesday.

However, counter-comments from other BoJ officials about the next policy move show there’s growing splits and indecision within the central bank about which types of stimulus mechanisms could be used, and to what degree. Considering that the primary goal of the BoJ’s open market operations has been to increase growth and inflation, while simultaneously weakening the JPY, their track record this year has been abysmal by every metric.

Recent Japanese inflation data has shown a consistent drift lower over the last five quarters, Industrial production and CAPEX have shown slight ticks higher (albeit from a historically low base) and the USD/JPY has been in a protracted down trend since posting a high of 121.60 in late January. All of this adds up to FX market internal indicators and options pricing showing the lowest expectations of the year that the BoJ can create a positive result.

Despite aggressive buying by the BOJ of Japanese listed securities and in particular through ETF’s, the Nikkei 225 has failed to develop a bullish technical pattern. At present, the pressure appears to remain to the downside and it’s only a break through resistance at 17,400 that would change the 12-month old bearish price structure. Both the Hang Seng (Hong Kong) and the Shanghai Composite (china) appear to be breaking-out and outperforming on  a relative basis.

Nikkei 225 Index

nikkeiHang Seng

hang-sengShanghai Composite

shanghai

US Yield Curve & S&P500 Technical Support

On September 7th, the SP 500 posted an all-time high close at 2184.00. At the same time, the US 10-year notes were yielding 1.53%, the US 30-years were yielding 2.23% and the 2-year notes were yielding .75%. Over the last five trading sessions, the SP 500 has dropped as low as 2118.00, or just over 3% from the 2184.00 high. Over the same period, the 10-yr yields have climbed to 1.68%, the 30-years to 2.46% (both 10% higher) while the 2-yr note yields have remained unchanged at .75%.

When the US yield curve enters a phase in which longer dated bond yields rise, while the shorter dated yields remain unchanged, it’s called a “steepening yield curve.” Many market commentators consider a steepening yield curve a fundamental negative for stocks since higher yields on longer dated paper suggest the US Federal Reserve will further normalize the Fed Funds rate; which will push Treasury yields even higher. Along this line of thinking, current Dow theorists believe that the market could reach a “yield inflection point” whereby stock investors will sell shares and switch to the guaranteed returns offered with Treasury securities.

US 10 Year Bond Yields

10yr

US 30 Year Bond Yields

30yr

S&P500 Index

sp500

It’s worth noting last night’s reversal in the S&P500, from the support level indicated by the horizontal black line. This reversal may signal the rise in bond yields will soon exhaust. As a result, equity markets may then resume their rally higher. However, during times of economic expansion, both equities and bond yields can move higher in tandem. That’s just not been the case in recent times!


Global Macro

After a slow start, last week turned out to be pretty solid for the USD as the unit was steady or stronger against all the G-7 pairs. Even though the mid-week economic reports on manufacturing were on the weak side and the US service sector expanded at the slowest pace in 6 years, Treasury yields moved higher supporting the USD’s rally. The US 10-year yield was up 16 basis points from the mid-week low  of 1.50% and reached its highest level since the UK referendum in late June.

However, US equity markets were beaten down after Boston FED President Eric Rosengren said there was a “reasonable case” for a rate hike at next week’s FOMC meeting. These comments pushed the SP 500 just below 2120 and, from a technical perspective, sets up a very ugly chart pattern. The Relative Strength Index (RSI) dropped from 54.2 to 31.00 and the MACDs have rolled over on the daily charts.

It’s worth noting that this is just one day and the major equity indexes may reverse course in short order, but it’s a reminder of how vicious the market decline was in January following the FOMC’s initial rate normalization from the zero bound.

Ahead of the media blackout period in front of next week’s FOMC meeting, FED Governor Lael Brainard will speak on Monday at an economic conference in Chicago. Ms Brainard has generally been in the dovish camp, and has tended to emphasize the international risks of FED policy trajectory. Her speech, on the outlook of the US economy, will be closely watched by market participants.

In this sense, if there’s no change in her core position or tone, it would lend support to equities, lower yields and lead to a softer USD. One the other side of the coin, any hint that the FED has been sufficiently cautious and that the normalization objectives have been met could lead to an extension of Friday’s price activity.

This type of diametrical “cause and effect” price prognosis is the ugly underbelly of the markets that the central bankers have created, and is what they fear the most. On balance, we maintain the view that the Fed Funds futures market has underestimated the possibility that the FED will lift the Fed Funds target band to .50% – .75% next week, and short-term traders have overestimated the resultant equity market impact within the broader bull market pattern.

Global Macro

Even though the European Central bank (ECB) lowered their 2017 and 2018 growth and inflation forecasts, and acknowledged that the risks to these forecasts are skewed to the downside, Mr Draghi and the other ECB governors made no adjustments to European monetary policy at yesterday’s meeting in Frankfurt.

The overnight deposit rate of -.40% was left unchanged, as expected. However, the ECB also refrained from extending the timeframe of QE from the current date of March of 2017; which was disappointing since it was the only policy action that market commentators were discussing as a highly likely possibility. Bond yields across G-7 treasury markets traded higher, ( Euro zone stocks lower) in response as further stimulus, against a weaker economic outlook, appears be delayed.

Only in the eyes of the ECB can a slower pace of economic and inflationary deterioration be considered an improvement in overall conditions. During his press conference, Mr Draghi pointed out several times their stimulus options are not exhausted and that the ECB has the will, capacity and ability to do more within their mandate. This includes extending the QE timeframe beyond March of 2017, when needed.

After all was said and done, a lot was said and nothing was done. There was no date provided for the new staff forecasts which sets up a “FED” style data dependency for Euro traders until the next key meeting in December.

After trading in a narrow 30 point range around the 1.1250 level prior to the ECB meeting, the EUR/USD climbed up to the 1.1320 level just after the announcement. However, as the NY session progressed the pair reversed lower on the eventual divergence between US rates moving higher and EU rates drifting lower.