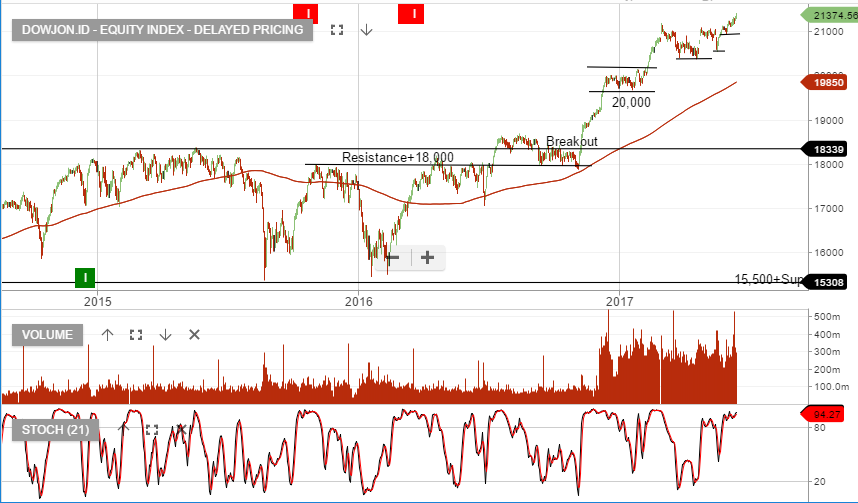
Dow Hits All-Time High As “Short Interest” Drops To A 10-Year Low

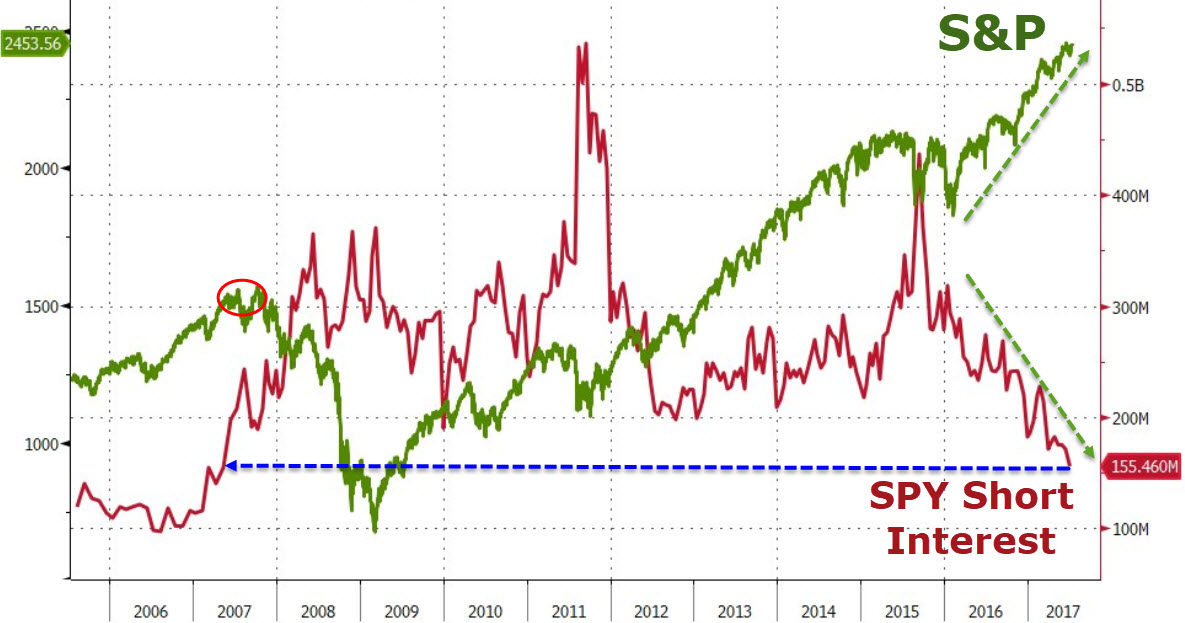
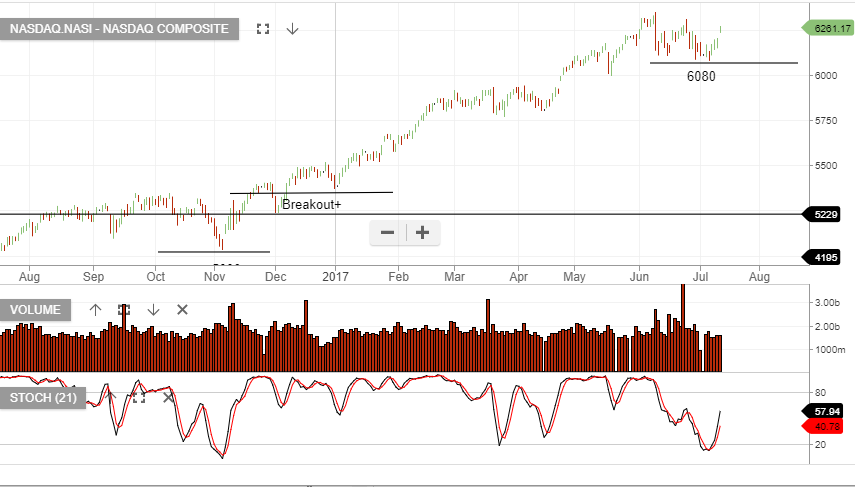
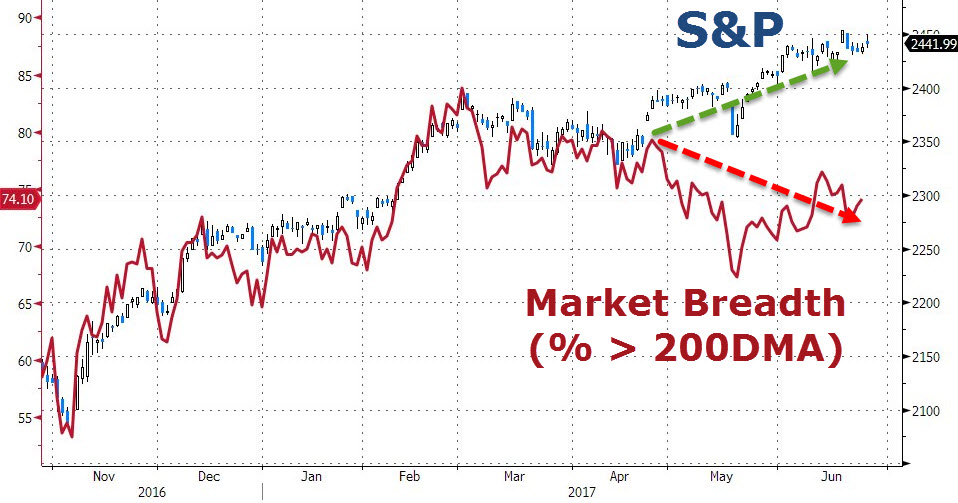
As both the Dow Jones 30 and the S&P 500 rose to new all-time highs this week, daily trading volume was 20% lower than the 3-month average and “short interest” in stocks fell to the 2007 lows.

Short interest is defined as the total Dollar value of stocks which investors have “sold short”, which they don’t own, with the idea of making a profit after buying them back at a lower price.

The combination of seeing the Dow and SP 500 rise to new highs on lower volume, and contracting short interest, is an illustration of a technical “short covering” rally.

Seeing index prices at new highs on lower volume suggests that “new money” is not coming into the market and that stock prices will revert lower after “short sellers” have taken their losses.

This technical combination doesn’t always trigger an immediate sell off in stocks. However, the market condition of “higher highs on lower volume” is often cited after a material correction in the market occurs.

As US earnings season goes into full swing next week, we’ll continue to watch the price/volume correlation and the potential impact on the market.


US Earnings Preview: JP Morgan, Citi and Wells Fargo

Before the US market opens later today, JP Morgan, Citigroup and Wells Fargo will report their Q2 results.

After last year’s post-election rally, these stocks and others in the financial sector have been trading in wide ranges.

However, over the last few weeks, bank stocks have rallied after the results of the FED’s “stress tests”, a push higher in short-term rates and hopes of further government de-regulation.

For Q2, JP Morgan is expected to report earnings of $1.57 per share, up 2 cents from last year on revenue of $24.8 billion. Wells Fargo is expected to report earnings of $1.02 per share, which is up 1 cent from last year on revenue of $22.3 billion. Citigroup is expected to report earnings of $1.21 per share, which is 3 cents below last year on lower revenue of $17.3 billion.

Our base case for the US banks is that trading revenues will be trending lower for the remainder of the year and the current levels look fully-valued with risk to the downside.

JP Morgan

Citigroup

Wells Fargo


US Banks Expand Share Buy-Back Plans

A week after the FED announced that 33 of 34 major US banks had passed their financial stress-tests, the banks have released their revised share buyback and dividend plans.

Analysts had estimated that positive stress-test results would open the way for banks to boost dividends and share buybacks by up to 25%, which could translate to about $30 billion back to shareholders through higher dividends and share prices.

Some of the specific plans include Citi-Group buying back up to $15 billion in shares and increasing their dividend to 32 cents per share, and JP Morgan buying back up to $19 billion in shares and lifting their dividend from 50 cents to 56 cents.

While these announcements were bullish for the share prices today, a longer-term valuation question is: How are the major US banks going to maintain these share and dividend levels?

Against a back drop of lower loan creation, thinner margins and increased bad loan provisions, we’ll track the recent price action and see if the bounce from the recent lows will be sustainable.

JP Morgan


US Update: Divergence In Market Breadth

As the SP 500 continues to trade near all-time highs, market analysts are reviewing various metrics to determine whether US Stock prices have more upside, or if they are ready for a downside correction.

One of these metrics is “Market Breadth.” Market breadth is a technique used to gauge the direction of the market by measuring the number of stocks trading higher versus the number of stocks moving lower

“Positive” breadth occurs when more stocks are moving higher than lower and vice versa for “negative” breadth.

The breadth numbers are used to determine whether the market has positive momentum or negative momentum.

The chart below shows that the SP 500 and market breadth have been diverging since late-April.

To put this divergence into perspective, as of last Friday, nearly 40% of SP 500 stocks were trading below their 200-day moving averages. In addition, 6% of the stocks listed on the NYSE hit new 52-week lows last week.

We will watch these measures closely to see if the current market pricing is resolved to the upside, or if the US Indexes commence a correction lower.

SP 500 vs Market Breadth


Chart Watch – Goldman Sachs

We’re watching the rebound in US financials as a leading indicator for momentum in the Australian banking shares.

The chart below of Goldman Sachs shows the minor bounce that’s recently taken place. However, it looks like selling pressure is now building and the short term momentum indicators have turned lower.

Unless, Goldman Sachs can trade back up through the $230 resistance, it looks like the rebound higher, could now be completed.

Chart – Goldman Sachs


Algo Sell Signal – General Electric

Our Algo Engine generated a “short” or sell signal in General Electric back in mid December, when the stock was trading $32. In last nights sell-off in the US, GE was the worst performing stock within the Dow Jones index.

The overnight selling is a continuation of the downtrend that has been in place since the December high.

Chart – GE


OVERNIGHT News: FOMC and Crude Oil

The FOMC announcement to raise the target Fed Funds rate by 25 basis points to 1.25% was largely priced into the market.

However, the “hawkish” guidance  about further upward adjustments and the specific plans to reduce the FED’s $4.5 trillion balance sheet have raised concerns about current stock market valuations and the impact of tighter monetary conditions.

The major US indexes were mixed with the NASDAQ down .50%, THE Dow Jones 30 up .25% and the SP 500 down .10%.

US Energy stocks were all lower as Crude Oil prices slumped on a downbeat assessment from the IEA and increased production from both the US and OPEC nations.

The front month WTI Crude contract closed down over 3% to $44.65, which is the lowest closing price in over 18 months.

As a result, shares in both BHP and Oil Search have opened more than 2.5% lower.

Chart – Dow Jones


ETF Watch- NASDAQ Sell-Off

The NASDAQ stocks rebounded last night with Facebook, Google and Amazon all trading over 1% higher after the two day sell-off over the weekend.

According to several “high frequency” analytical reports, it’s too early to step back into the FANG stocks. Of the four times that a similar high volume sell-off has occurred since 1999, tech shares have needed several weeks to find a bottom.

In addition, as shown in the chart below, the last few days have seen the largest capital outflow since 2007 from the QQQ: the NASDAQ based ETF.

Our ALGO engine created a buy signal on the ASX BetaShare NASDAQ ETF on February 8th, 2016.

That ETF, with the symbol: NDQ has gained over 32% since then. Should the recent sell-off in the NASDAQ turn into a deeper correction, we will watch for the next ALGO buy signal.

QQQ ETF


BetaShare ETF: NDQ